What will be required for Distributed Energy Resource Management System solutions to model and control increasingly complex grids and asset portfolios? Recent work by Sameer Kalra and his colleagues at Pacific Gas & Electric provides a sense of what is being developed from the point of view of underlying advanced analytics capabilities.
DERMS at PG&E
PG&E is on a path with its Distributed Energy Resource Management System (DERMS) to meet more dynamic grid and market needs by monitoring behind-the-meter energy assets in coordination with central dispatch to optimize operations and planning.
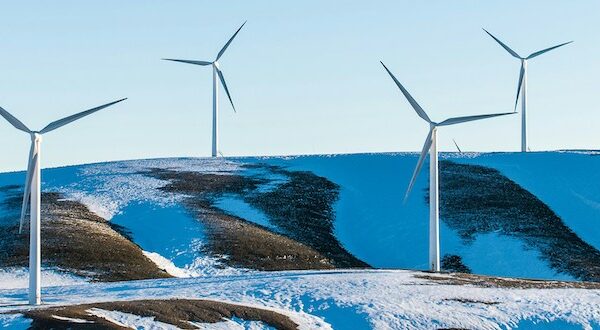
Recently-announced plans to retire a gas-fired combustion turbine in Oakland demonstrate PG&E’s commitment to relying on next-generation forecasting and advanced analytics tools. According to PG&E, the replacement of the plant in Oakland will be the first instance of clean energy resources being proactively deployed as an alternative to fossil-fuel generation for transmission reliability in its service area. (See box.)
PG&E’s having won CAISO approval Thursday to provide a clean alternative to a decades-old fossil-fuel power plant in Oakland was highlighted in Jennifer Robinson’s 3/22/2018 PG&E Currents article, “Groundbreaking Oakland Clean Energy Initiative Clears Important Hurdle.” Roy Kuga, vice president of Grid Integration and Innovation for PG&E, stated: “The Oakland Clean Energy Initiative represents an innovative, tailored portfolio of distributed clean energy resources combined with traditional transmission substation upgrades that meet the local reliability needs in this area of Oakland, enabling the retirement of the aging, jet fuel-powered plant.”
(Source: PG&E Currents.)
PG&E’s EPIC Program
Sameer Kalra is a smart grid technology and product innovation strategist at PG&E. Kalra’s recent efforts have included demonstrations of new technologies and advanced analytics-based models to support improvements in load forecasting capabilities. His work has received funding under California’s wide-ranging Electric Program Investment Charge (EPIC) program.
When it comes to meeting utilities’ next-generation advanced analytics needs, a measure of success will be the establishment of robust predictive models and visualization and decision-support tools to meet tighter requirements for short-term forecasting and dispatch, down to the local distribution feeder level, by fully leveraging the potential of Distributed Energy Resources (DERs).
A big portion of the value to be found in the real-time capabilities of such solutions comes from reducing or shifting peaks in electric demand. Leveraging rooftop solar PV, along with electric vehicles and other forms of energy storage and distributed generation, such solutions help coordinate aggregated Demand Response (DR) resources and facilitate a more resilient and reliable grid.
To achieve the goal of a more reliable short-term forecast at local distribution system levels, it is necessary for models of the distribution system to have reliable access to real-time load data collected at more frequent time intervals. Via smart meter data, such models can provide sufficient granularity, even in areas of the service territory which do not have full SCADA penetration.
Discussion with PG&E’s Sameer Kalra
UAI: Does PG&E’s commitment to replace the combustion turbine in Oakland with 100% clean resources represent a big vote of confidence in the advanced analytics capabilities you’ve been developing?
Kalra: Yes, in general, but let me clarify. My work and the work of my colleagues spans across a lot of different areas of responsibility across PG&E’s various service territories, and it is a very exciting time for all of us. But I should point out that PG&E has not yet determined the actual mix of demand-side versus supply-side resources which will be ultimately brought to bear to meet demand in Oakland, after the recently-announced plan for future retirement of the combustion turbine there. And, like any large utility, PG&E’s service territory displays variations between different parts of the service territory, due to a range of factors including variations in the size and composition of the residential, commercial, and industrial customer base. As a result, PG&E has a lot of different 100% clean energy options which will be exercised in different ways, as a function of local variations between different parts of its service territory. But certainly, the option of meeting the Oakland gas turbine retirement using a similar DER mix (per other recent work, including demand response and solar PV), is among the options on the table.
UAI: Noting in your recent work the improvements you’ve gotten underway, with next-generation Distribution Modeling, Load Allocation, and Power Flow Analysis capabilities, what challenges has your team addressed?
Kalra: We have been able to capture circuit and bank peaks by collecting loading data at more frequent intervals. Before starting this work, the existing practice for estimating peak demand used a “point in time” analysis that allocated loads based on monthly kilowatt-hour consumption. This method’s accuracy needed to be improved upon because it does not show full peak fluctuations. We also had to develop capabilities to roll out this more detailed model even in areas where Distribution Operations does not have full SCADA penetration. And we have also been addressing varying latency in input data, along with topology issues and cross reference issues between various systems due to different keys being used.
UAI: So going forward how do you address more dynamic situations? Let’s say cloud cover is approaching across a certain part of your distribution system. Will your solution have the needed responsiveness to help compensate for changes in output from rooftop solar PV?
Kalra: Yes, not only due to local impacts of changes in cloud cover, but also taking into account the full portfolio of DERs dynamically. For example, in coordination with detailed load profiles, your demand response resource modelling has to include fluctuations in air conditioner loading based on real time meter loading data to provide detailed and precise information for enhanced distribution planning and real-time distribution grid operations. And the dynamisms span beyond this, to also include utility-owned energy storage as well as aggregated DERs from a Distribution Service Market which could include smart inverters, EV charging stations, and other energy storage.
UAI: What advanced analytics tools are being applied going forward?
Kalra: We are utilizing machine learning to address the huge data volume to be handled. In addition, our tools have been optimized to facilitate greater levels of customization, for example due to the need to tailor each use case based on different granularity and frequency of forecasts required.
UAI: What interesting differences are you running into, in terms of what you have to deliver for different use cases within PG&E?
Kalra: From a top-down level, our two biggest internal customers are Operations and Planning. The way these two groups utilize solutions and data varies, yet both tap into a lot of the same basic tools we are providing. These tools include visualization mechanisms for users to view historical and forecasted load curves and load shapes for Network analysis, Emergency Load Transfer, and real-time loading views on non-SCADA devices. Workflows to be served have included proactive emergency mitigation, node-level load forecasting compared against line and device ratings/configurations can alert operators to potential overloading conditions, and proactive switch plans which can be generated to reduce likelihood of outages. So, for example, our node-level load forecasting provides hourly load estimates, which are employed for daily Operations need, but we also provide forecasting up to 10 days in the future for better planning of planned maintenance outages, as well as power procurement.