Getting better at storm-related outage prediction
Utilities need to know the “ground truth”
One of the utility’s primary missions is to minimize outage frequency and duration. Outage prevention is even more important during the COVID-19.
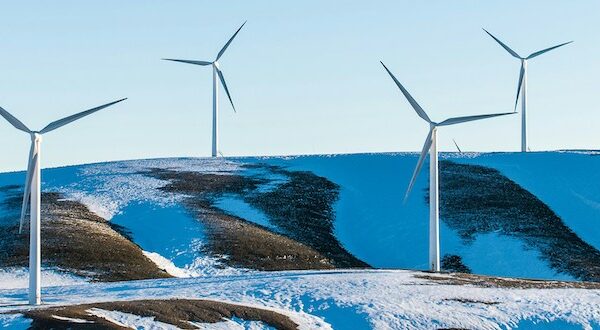
Until recently, storm-related outage prediction has been limited by lack of data and the use of spreadsheet-based models. The good news: Up-to-date granular data (geo-referenced weather forecasts, satellite and multi-spectral images, etc.) is now available. New modeling approaches (predictive analytics and machine learning) make modeling more accurate, flexible and faster.
Why get better at outage prediction?
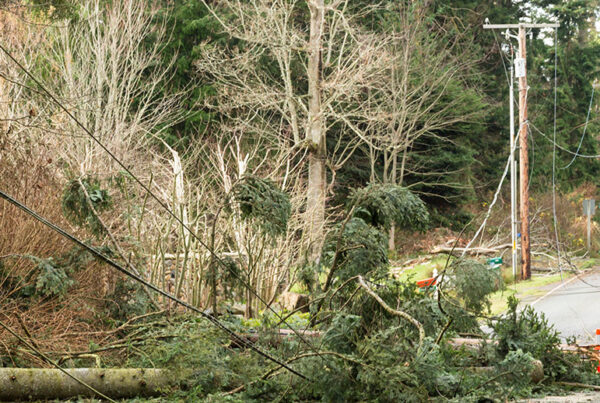
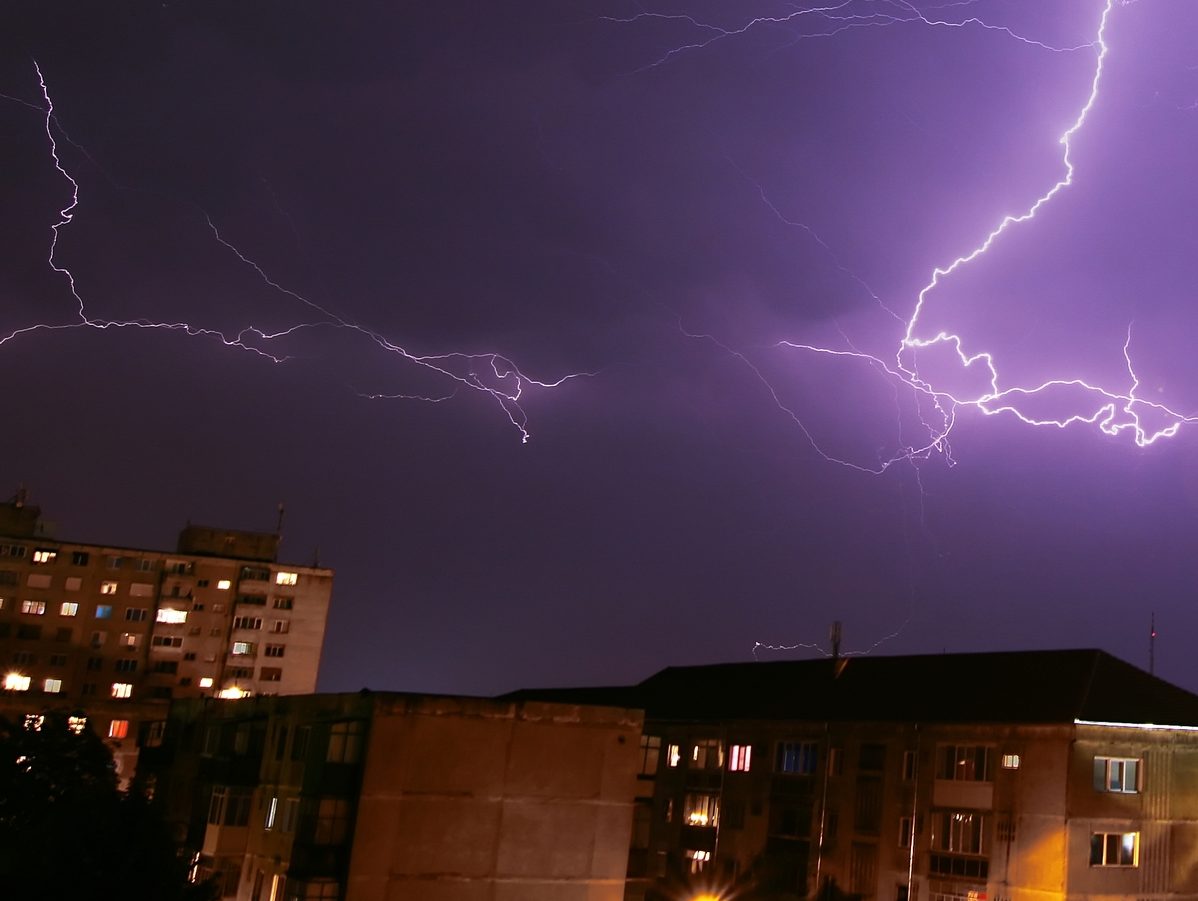
Many utilities have experienced upticks in extreme weather events. According to Eaton’s annual outage tracker, all of the top ten outages in 2018 involved weather.[1] Vegetation is very much involved in storm-related outages. Think wind snapping branches and toppling whole trees onto power lines and ice storms weighing down lines.
Early identification of hot spots aids in targeting high risk trees weeks ahead of a potential storm. Knowing the trajectory of the storm days ahead informs preparations for dispatch of restoration crews. Tracking the trajectory of the storm as it happens makes outage response more flexible and efficient. Having more accurate insights into a probable outage – whether it requires a truck roll, is a pole down or involves a blown transformer– could significantly impact management priorities and preparations.
There is modeling, and then there is modern modeling.
Predicting storm-related outages is not new for utilities. Many utilities have models populated with static historical data from outage management and/or vegetation management applications, coupled with weather data to predict potential impacts (see Wisely Managing Vegetation at the Distribution Level).
Modern modeling can accommodate data inputs of the geo-spatial location of vegetation, the more granular the better. A recent study[2] has shown that including vegetation data in a hurricane outage prediction model can improve model accuracy by 3% when tree species are included. Additional data, including tree heights, branch failure characteristics and site factors, such as soil moisture and wind exposure, step up the model accuracy even more.
Then, too, traditional models have difficulty handling spatiotemporal information. Five years ago, utilities used forecast data at the zip-code or higher level. That level of detail is not enough to match storm forecasts to grid segments. Most utilities today cannot match storm severity and types (convective, tropical, etc.) with circuits and surrounding vegetation. That is, unless their analytics architecture is built for scale. However, these capabilities are now within reach.
As in any project, utilities will need to determine whether to acquire more advanced capabilities. As usual, the questions are the same. How much data should we reasonably expect to handle? What can we learn from it? How soon should we expect a return on an investment?
Some utilities have analytics teams experimenting with analytics sandboxes on a small scale. Two larger scale approaches are discussed below:
Build, then buy – maybe
Over the course of ten months, one large municipal utility developed a neural network architecture to improve predictions of weather-related outages. System operators, dispatchers, call centers, and reliability teams now have role-based access to visualizations of at-risk circuits.[3]
The architecture has a sandbox with an in-house data platform. The platform can accept inputs of weather data (in 3 km blocks updated every hour, 36-hour forecasts are updated every 6 hours), meter events, substation data, customer characteristics, and GIS topology. Also included are spatial analytics, open source libraries, query repositories and visualization tools. The platform accepts basic vegetation data (publicly available in 1 km blocks) but the models do not incorporate vegetation yet.
Benefits/lessons so far:
- Models need to evolve “as-you-go”. For example, the initial model was a regression. The team discovered that classification needed to happen before the regression model could produce valid results. The next evolution will use a time series model.
- The experience of building an architecture that ingests large amounts of data, trains models and communicates results will be helpful for other projects.
- Even if the decision is made in the future to buy, with this experience, the utility can make more informed decisions.
Buy for scale
New Brunswick Power and Hydro One, have opted to implement various versions of IBM’s The Weather Company (TWC) storm-related outage prediction analytics.
The platform, hosted by IBM, ingests big localized weather data and forecasts. This data feeds a machine learning classifier that categorizes multiple storm and weather attributes. The platform can accommodate 2D and/or 3D vegetation, supplied by IBM or the utility, overlaid in the GIS environment.[4] Weather, vegetation and outage history data feed into a scoring model for assessing storm-related outage risk.
The platform selects appropriate models to use in the analysis. The utility is able to run what-if scenarios, such as a change in wind strength or direction, on an hour-by-hour basis and visualize potential impacts. The offering also comes with a storm library of outages and related weather. Soon to come is full incorporation of asset health into the modelling.
Benefits/lessons so far:
- Every utility has unique circumstances – tree species, equipment health, weather patterns – and storms are often unpredictable in their movement. There are no rules of thumb. Having a library of models and discrete data sets provides flexibility.
- Hydro One’s initiative covering over 50 operation centers has improved SAIDI by 18% and customer satisfaction by 8%.
- New Brunswick Power has provided IBM geospatial files identifying the location of their overhead power lines. This data is being combined with geospatial data depicting the state of vegetation to train the models and improve the accuracy of outage predictions, thus reducing operational costs.
[1] Ice storms, hurricanes, tropical storms, high winds which call for planned outages to prevent wildfires.
[2] Improving the Hurricane Outage Prediction Model by Including Tree Species, 2019. The model used statistical/machine learning
[3] Each of the upcoming 18 hours can be visualized.
[4] While the less frequent, more expensive LIDAR data provides insights into how the height of vegetation might impact power lines, the less expensive more frequent 2D data is a reliable source of the whether trees have been recently trimmed, as well as general side encroachment into trimming corridors.