
Across the board utilities are seeing extreme shifts in energy demand due to COVID-19 lockdown orders, particularly increases in residential consumption. The unpredictability of energy demand makes it hard to manage the grid, so the more utilities can understand new consumption patterns, the better they can prepare for rapid grid changes.
Bidgely analyzed COVID-19-related grid changes from sample utilities to demonstrate the importance of isolating variables to discover true causation of load shifts. We believe unless you are able to understand consumption by appliance and by user categories, you are at risk of making assumptions that are unsupported by data and risk losing customer confidence through the dissemination of inaccurate information.
2019 vs. 2020 Comparison
For a broad look into how lockdowns affected energy usage this year, we first compared total consumption between March 20 – April 21 for the years 2019 and 2020. As the graph below shows, 2020 experienced higher consumption overall, and morning peak loads have shifted a few hours later in the day.
(Image 1)
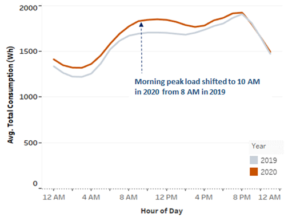
But, temperatures were colder in 2020 than 2019. Could this increase in consumption simply be attributed to more people running space heaters than normal?
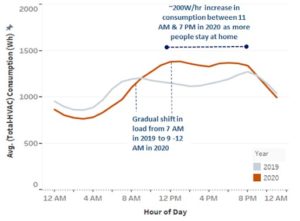
To get a clear picture, Bidgely UtilityAI™, which disaggregates energy consumption down to the individual appliance, was able to remove the variable of temperature change at that specific time of year to analyze consumption without the space heating (HVAC) component.
Even after eliminating HVAC load, the gap in the graph below continues to expand, proving the year-to-year difference in base consumption was more impacted by customers staying home than temperature changes. In total this represents a ~14% increase in consumption in 2020 for the entire analyzed set on weekdays for this specific utility.
(Image 2)
Higher average consumption is, as we know, due to COVID-19 lockdowns, as people are staying home and using more energy as a result. On the surface, this information offers limited value to a utility’s ability to manage the grid, nor does it provide customers with clarity to control their energy costs. Diving into the specific ways and times consumers use energy, however, helps utilities understand how this change in behavior is affecting grid patterns, which allows for more accurate planning and preparing of grid loads.
We also notice the 7AM peak in 2019 is no longer visible in 2020, and instead see a gradual increase in load, likely owing to the fact people are waking up and starting their day later during lockdown. A significant increase in mid-day consumption (~200 Whr), particularly between the hours of 11AM to 4PM, signifies people who would typically be away at work are now home for an extended period of time.
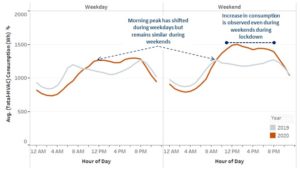
Weekends are similarly affected, following the same pattern. The peak shift observed on weekdays increases tremendously during weekends as people are home doing more household chores, cooking and laundry. As shown below, the belly of the curve completely disappears.
(Image 3)
Understanding these new timeframes, we can analyze the specific factors contributing to this increase at the appliance level for a 360-degree view of a household’s energy behavior. Take water heaters as an example.
(Image 4)
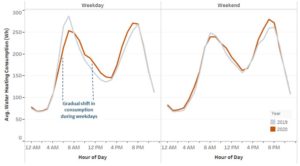
Water heater consumption shifts slightly from 6AM in 2019 to a more gradual spread of consumption in 2020. Knowing that people are waking up later, this analysis demonstrates people are not getting ready for work as early and therefore not showering as much, or for as long, as they did in 2019.
Pre-Lockdown vs. Lockdown
As predicted, comparisons of total consumption between pre-lockdown period (March 1 – March 19, 2020) to lockdown (March 20 – April 21, 2020), once again verify the same shift in morning peaks and increased weekend loads.
Prior to lockdown orders, weekday morning consumption remained quite consistent, whereas lockdown shows higher deviation.
(Image 5)
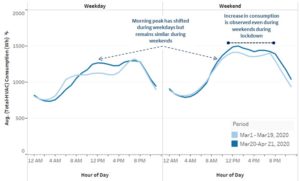
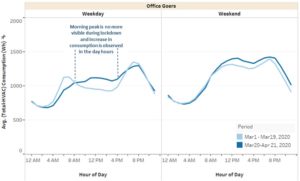
UtilityAI is able to take this appliance consumption and variance analysis a step further by generating lifestyle clusters for customers and their energy behavior. We applied an algorithm based on ground truth that detects officer-goers (homes with high probability of not having significant activity during day time) and stay-at-home users (significant activity during the day time).
When comparing load curves pre/post COVID-19 lockdown, we found that 75-80% of officer-goers exhibited changes in their behavior consistent with stay-at-home users during the COVID-19 lock down period. On weekdays, there is an increase of ~14% consumption for office-goers in lockdown between 10 AM – 5 PM. The same can be seen for stay-at-home users with a ~8.6% increase.
(Image 6)
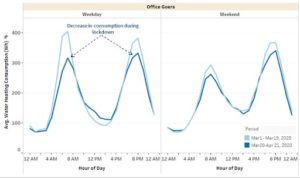
The comparison also reveals that office-goers are taking fewer showers in the morning and evening and distributing showers more to the middle of the day. During weekdays, there was an approximately 18% decrease in water heater consumption for office-goers vs 1.04% decrease observed in the total population, and a 2.8% change for stay-at-home users.
(Image 7)
These data insights are easily confirmed through common knowledge and our collective experience of COVID-19 lockdowns, but it is important to note that only by taking into account variables like weather changes year-over-year and removing HVAC usage from analyses can we discover that behavioral change has indeed occurred. The cluster analysis capability then becomes a powerful tool in a utility’s ability to connect in a meaningful way with its customers. Especially as the economic downturn caused by COVID-19 hits vulnerable demographics, a utility’s ability to be accurate and specific about energy usage is the path to true energy savings.
Learn more about how to use Bidgely’s UtilityAI analyses for your operations:
https://go.bidgely.com/Building-Resilient-DSM-in-the-COVID-19-Environment_Download.html?