I live in Marietta, Georgia, a suburb of Atlanta, and while we are not in the city proper, the neighborhoods are still densely packed. Power in this area is provided by Cobb EMC, one of the largest electric membership cooperatives in the U.S., serving over 200,000 customers covering portions Cobb, Paulding, Bartow, Cherokee, and Fulton counties in Georgia. Every time I go on a walk around my neighborhood, I marvel at the sheer number of power poles and the counts of devices like transformers, reclosers, switches, fuses, and insulators that I pass in just a few miles of walking. This simple observation in my neighborhood is a microcosm of the complexity inherent to our nation’s sprawling electric distribution systems.
The U.S. Energy Information Administration (EIA) report summarizing utilities’ spending demonstrates important trends indicative of the challenges with these complex and aging systems. First, as one might expect, utilities are continuing to spend more each year on distribution networks as these networks grow to support an expanding population. A more telling trend is that while the count of electric customers has grown 21% over the past 20 years, the utility spend on distribution has risen over 64%. The fact that spending is heavily outpacing population growth leads to the general acceptance that the distribution area is ripe for the introduction of new and innovative approaches to improve reliability performance, as well as reduce the cost of operations and maintenance (O&M). Indeed, utilities are constantly seeking better ways to approach the maintenance of the equipment hanging on these power poles, but several challenges endure:
- Overhead equipment typically doesn’t have sensors for measuring parameters indicative of their health.
- Installing sensing on millions of assets would quickly become cost prohibitive, not to mention the challenges of adding communications networks to backhaul the data for analysis.
- Utilities have historically deferred to manually intensive inspection programs to assess a specific class of assets (for example, transformers) on a periodic basis, and some utilities perform rotating annual inspections that cover a subset of their circuits each year.
- The majority of overhead equipment is operated as “run to failure” — meaning that it will get replaced once it fails. This approach to equipment maintenance is a major driver of power outages and dissatisfied customers.
In early 2022, with the help of SAS and its partner Exacter, Randolph EMC, an electric membership cooperative headquartered in Asheboro, North Carolina, began a journey to solve this cost challenge and make predictive maintenance for distribution assets at scale economically viable. Jacob Barlow, Senior Project Manager at Randolph EMC, John Lauletta, CEO at Exacter Inc., and I will discuss this journey at the T&D World Conference and Exhibition in our session “A Maintenance Hat Trick: Safety, Cost, and Reliability” on Thursday, October 6, 2022, from 3:15 – 4:00 p.m. We’ll provide details about planning for and implementing the project and would love to have you join us.
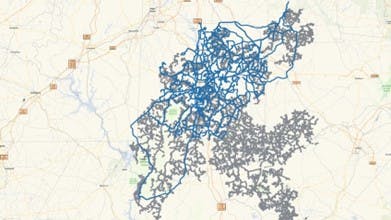
Until then, I’ll fill you in on some of the highlights of the project. Looking at the Asheboro area’s population and grid assets gives us a sense of the scale and spread of distribution assets — not just for Asheboro, but for most communities. The map in Figure 1 of the Asheboro area, with a population of approximately 30,000, illustrates the number of assets/devices in the overhead distribution network (over 230,000) — represented by the grey shaded areas. Imagine how this count of assets climbs with larger and larger communities. There are nearly 10 times as many assets as people in any given area. The scale and spread of these distribution networks can be mindboggling at times — leading to the challenge of how to drive predictive maintenance with such systems. The blue areas in the map highlight a key component that can drive economic viability of predictive maintenance for the distribution network.

Figure SEQ Figure \* ARABIC1: Assets & devices in the electric distribution network in Asheboro, N.C.

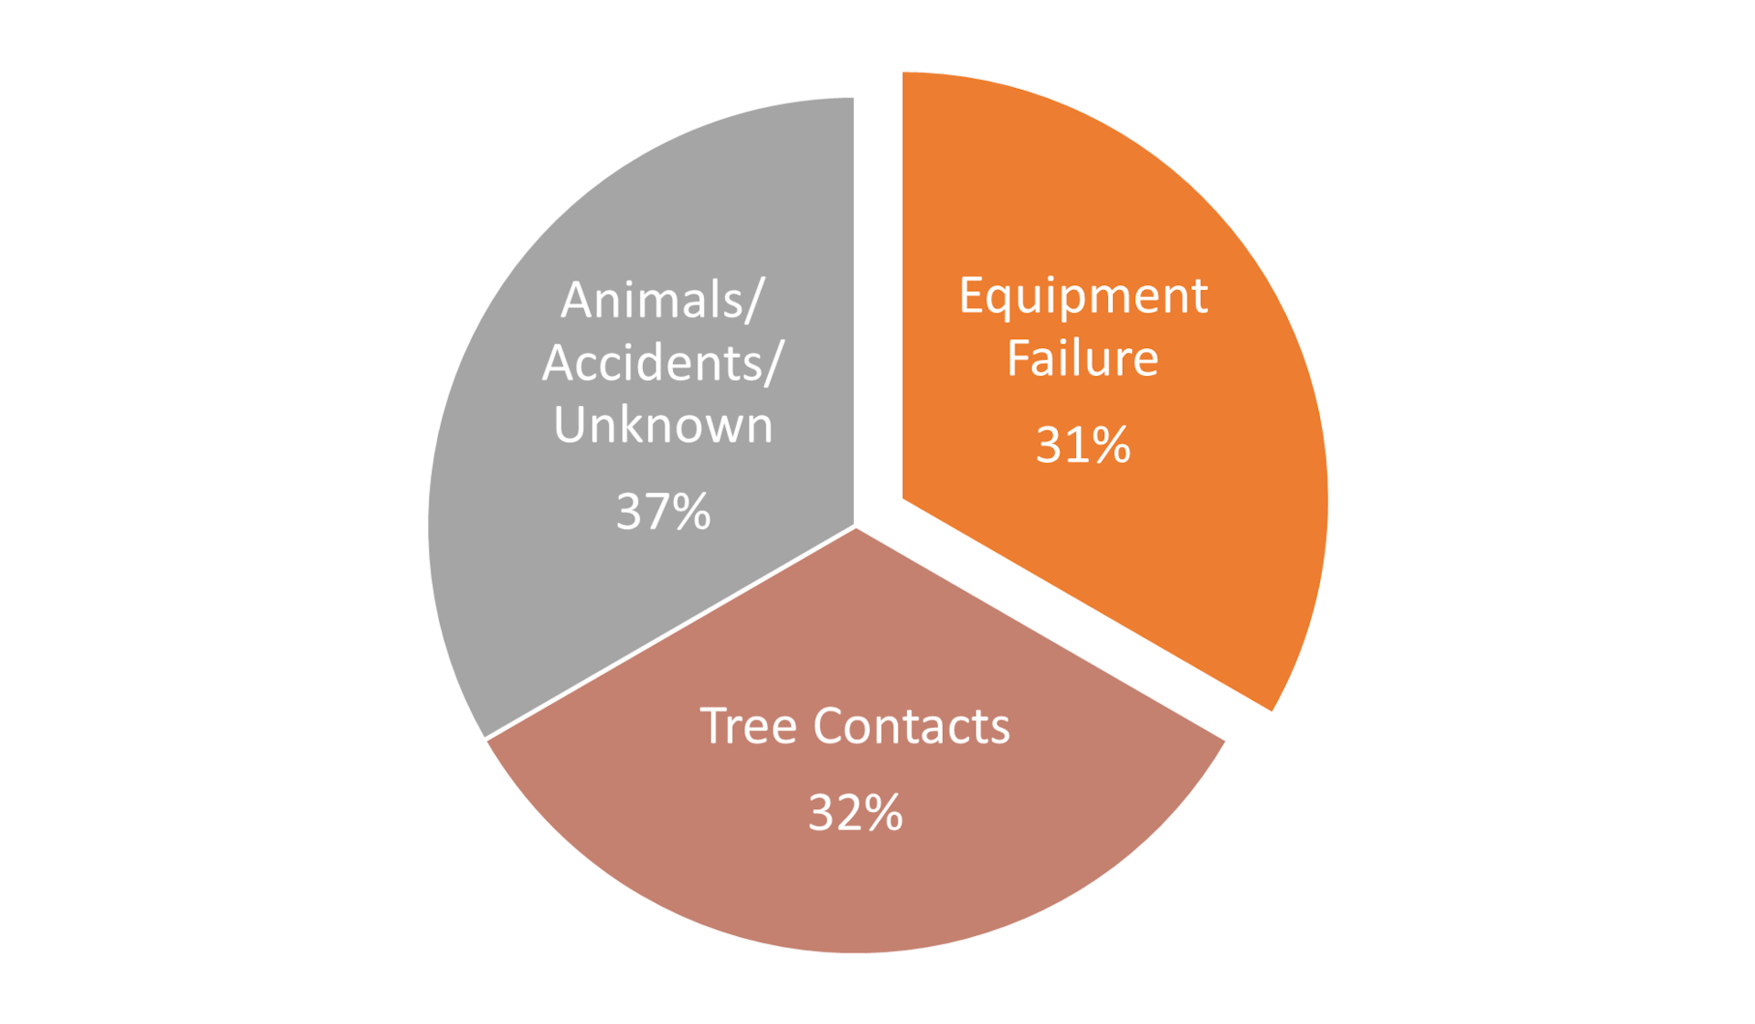
Figure SEQ Figure \* ARABIC2: Typical power outage causes for U.S. utilities
In Figure 2 (pie chart), you’ll see typical values for power interruption causes for U.S. utilities. The Equipment Failure category accounts for roughly one-third of the interruptions and represents an equally significant portion of O&M cost associated with outage restoration. If utilities could convert the Equipment Failure category from a reactive maintenance regime to predictive maintenance, they would see substantial improvements in productivity and cost. According to Deloitte’s Position Paper, “On average, predictive maintenance increases productivity by 25%, reduces breakdowns by 70%, and lowers maintenance cost by 25%”.
What if your utility could effectively use mobile edge sensing combined with advanced analytics and AI to make predictive maintenance possible for your electric distribution systems? For utilities, this could mean 70% fewer equipment-related outages that would, in turn, drive substantial improvements to reliability KPIs, like SAIFI and SAIDI. Most importantly, utilities can realize massive reductions in O&M costs — the largest line item on most utility budgets
As an example, consider a common utility approach to assessing the benefit of avoided restoration costs while making conservative assumptions on SAIFI and CAIDI improvements gained by moving to predictive maintenance.
Benefit=∆CrewTime*CrewCost+∆Expenses
Where,
∆CrewTime=#InterruptionsBase*(CAIDIBase–CAIDIPost*(1-%ChangeSAIFI ))
Assumptions:
Crew Cost = $400/hr
∆Expenses = $0 (assumes that cost of asset replacement is the same regardless of timing)
CAIDIBase = 100 minutes
CAIDI Improvement = 10%
SAIFIBase = 1.1
SAIFI Improvement = 10%
Customer Count = 100,000
Then,
∆CrewTime=110,000*(100-90*(1-0.1 ))
∆CrewTime=2,090,000 minutes or 34,833 hours
Benefit=34,833hr*$400/hr+$0(zero change in asset cost based on time of replacement)
Benefit=$13,933,333
A more conservative approach would be to assume no impact to CAIDI and rely on the SAIFI improvements alone. Even with this much more conservative assumption, the benefit would still be over seven million dollars.
Here are specific details on the steps SAS, Exacter and Randolph EMC took for effective data collection and analysis:
Data acquisition
Improvements started with acquiring good quality data across different sources and formats from mobile sensing at the edge (e.g., sensors mounted on fleet vehicles — typically garbage trucks) and utilities. Randolph EMC’s geographical (GIS) and customers-served information relating to their circuit network as well as outage data were foundational to positive outcomes.
Data transformation
This data was then transformed using SAS’ ETL toolkit to clean and normalize the large data sets.
- For example, millions of rows of data from fleet vehicles were collected and analyzed to determine which signals were indicative of an equipment issue.
- Then, computational analysis was performed on GIS data to identify key characteristics of Randolph EMC’s distribution network.
Data analysis
Once the data was transformed, it was critical to the success of the project to leverage SAS’ industry-leading advanced analytical and AI capabilities to identify the location of compromised assets. The challenge lies in connecting the radio frequency (RF) values detected on the route to specific asset locations within the GIS data. As every signal detected could be coming from multiple assets within close proximity, multiple passes are used to improve accuracy and repeatability of issue location identification. These key steps were established to solve this challenge:
- First, group assets using a clustering algorithm, which then looks for detected RF value within a specified radius and associates it with the appropriate assets.
- Next, apply a set of rules to identify locations with consistent emissions from pass to pass.
- Then, conduct network analysis to understand circuit topology and to identify protection zones which are used for intelligent prioritization of assets for predictive maintenance.
- Finally, present the information in easy to consume formats supporting decisions for predictive maintenance.
Learn more at www.sas.com/grid-guardian-ai
Reference materials:
- Fatality and injury rates from BLS.gov – https://www.bls.gov/opub/mlr/2018/article/workplace-hazards-facing-line-installers-and-repairers.htm
- Electricity rates and revenue estimates from electricchoice.com – https://www.electricchoice.com/electricity-prices-by-state/

Craig Foster is a solution and business development executive in the IoT practice at SAS.
Sponsored by:


