Data insights from Asset Invest Planning (AIP) software helps utilities identify the areas most prone to wildfires and prioritize their investments accordingly.
How are you making sense of your wildfire data?

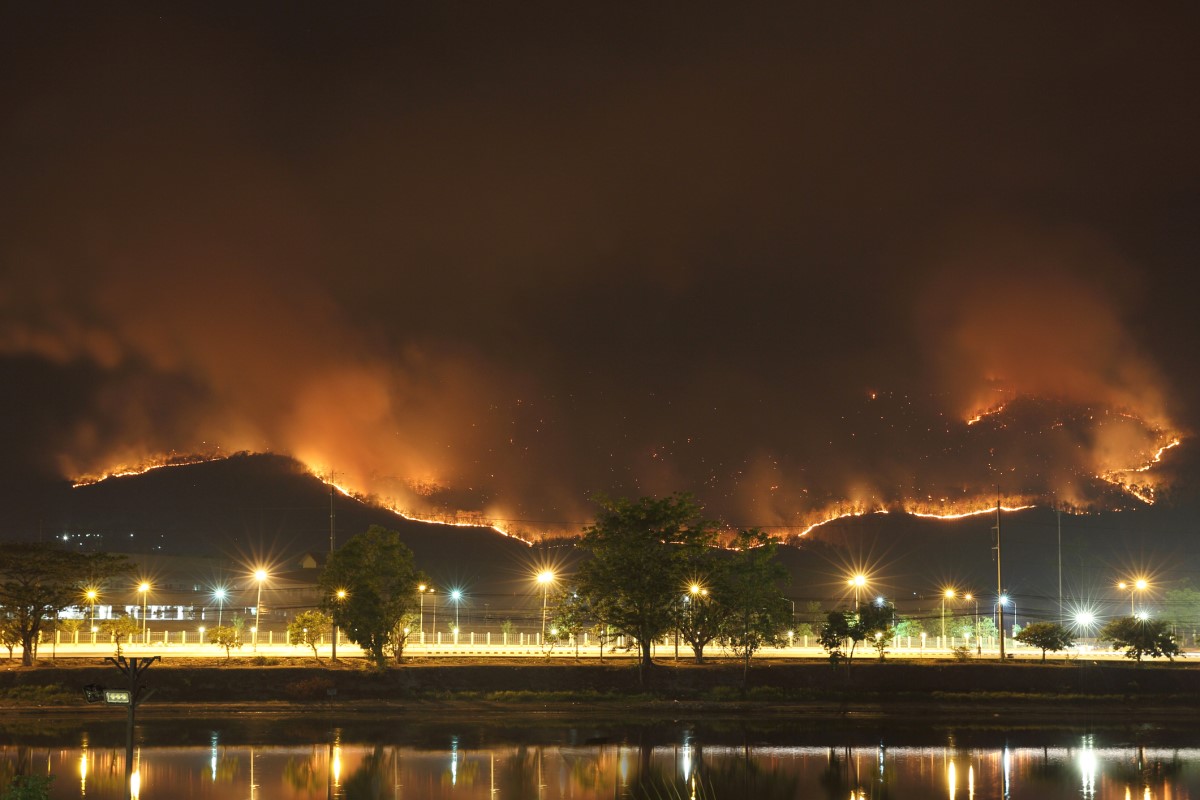
California has had a stormy, rainy winter, and while that has caused its share of problems, it has also eased the state’s multi-year drought. Those dry conditions led to devastating wildfires in 2020 and 2021, burning more than seven million acres in total. It might seem like the wet weather will finally offer relief, heralding a calm fire season this summer. But there’s a risk the opposite could be true.
It’s something called a wildfire paradox. Lush vegetation has exploded to life after the winter’s abundant snow and rain, but if dry conditions return, all that new growth will become kindling for summer fires.
This risk underlines the impact of increasingly volatile weather conditions. And the overall trend remains unchanged: scientists have warned that extreme wildfires will become 57% more frequent by 2050. That’s not just true for California, but the entire American West.
Wildfires are an increasing concern for utilities across the western U.S.
From large utilities to municipal providers and co-ops, all utilities are feeling pressure to comply with regulations, to understand their data, properly map their risk and to justify their decisions to regulators. To make matters even more complicated, the regulatory picture keeps changing, with new requirements every year and little idea of what to expect in the future. Even those utilities that are well prepared today when it comes to wildfire risk management, may not be in the future.
The consequences of being ill-prepared are serious. Eight percent of wildfires in California are caused by issues with electric utilities, and even when a utility is not at fault, it is held responsible for damages whenever its equipment is involved in a fire.
In 2018, faulty electrical equipment in California sparked the Camp Fire, which killed 85 people — the state’s deadliest blaze on record. The utility that owned the equipment was held responsible for that fire, putting it on the brink of bankruptcy.
The situation prompted state lawmakers to introduce the Wildfire Protection Package, which requires utilities to develop comprehensive wildfire mitigation and prevention plans, while also allowing them to spread the cost of damages across several years through loans and rate hikes.
Create value from your wildfire data

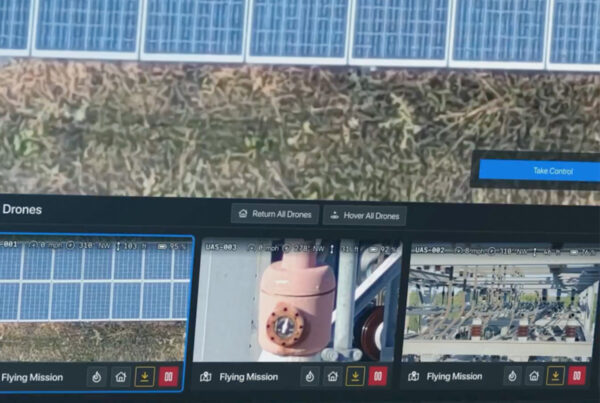
To that end, utilities have started to collect many different types of data from different sources. New modeling software powered by artificial intelligence uses satellites, drones and LiDAR to collect data on weather, vegetation and fire incidents, combining it with data from news and social media to predict wildfire risks. Combined with the asset health data that utilities already collect, it’s a formidable array of information that can shed light on wildfire prevention strategies and lessen the damage they cause.
All of that adds up to a lot of information that needs to be processed. Understandably utilities are struggling to make sense of it, and to find the insights that show them what their next steps should be when it comes to strategic investment and intervention planning. They need help turning this data into knowledge so they can make decisions of where, when and how to spend their money, to reduce the number of fires they cause or are impacted by.
How to make sense of your wildfire data with asset investment planning software
AIP solutions help utilities ingest data and build models they can use to improve their decision making when it comes to how they can best map the spread of risk while meeting their long-term goals. With new technologies giving them ever greater insight into wildfire risks, and the vast amounts of data being collected, there are concrete steps they can take to make sense of it all.
For instance, they can collect and analyze data on past wildfires, including their causes, locations, and impact, to identify the areas that are most prone to wildfires and prioritize their investments accordingly.
They can also use predictive analytics to forecast the likelihood of future wildfires in different areas, which can help utilities identify the areas that are most at risk and prioritize their investments accordingly. 
It’s also important to implement risk management strategies, because to understand the overall risk when it comes to wildfires, utilities need to consider in-service risk and fire risk, the breakdown of each element and its evolution over time. It’s crucial to build a risk framework that takes into account each utility’s location, objectives and current state.
Finally, there is what-if scenario planning. If a utility doesn’t invest in the health of its assets, and they fail, what is the cost and impact of replacing them compared to proactively investing and intervening before failure?
To answer that question — and to make sense of the many scenarios raised by the fire prevention and mitigation data they are collecting — utilities need insights into their data so they can plan for all eventualities.
With widespread electrification and growing demand for electricity, utilities everywhere are expanding their capacity while also dealing with the growing risks of climate change and the ever more extreme weather it is causing. Grids need to be resilient enough to withstand damage, and they also need to be as strong and well-maintained as possible, so they don’t cause any damage in the first place.
With wildfires becoming more common and more severe, it’s important utilities have a full picture of all their assets, risks and opportunities to survive and thrive in an unpredictable future.
Your wildfire risk is unique, so your mitigation plan should be too. Ensure the strategies you’re implementing help you achieve your business goals while staying compliant with regulations.
Sophie Furnival is the Senior Content & Marketing Communications Manager for DIREXYON Technologies.
Additional articles by Sophie Furnival:
Building Resilience in Utilities: The Why, the What and the How – Utility Analytics Institute


