The State of Utility Analytics from the SAS 2019 Global Utility Industry Survey
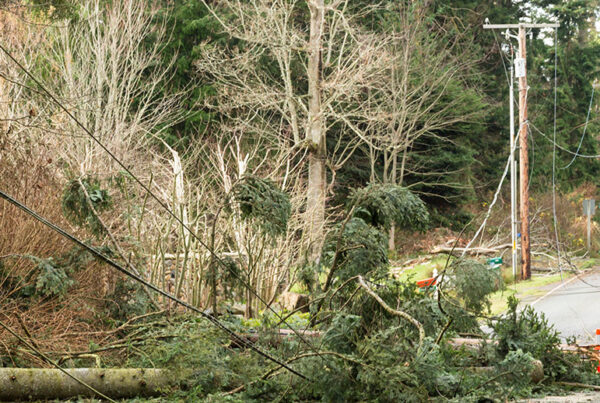
The utility industry in 2019 is in many regards barely recognizable from the utility industry just 10 years ago. The growth of renewables, electric vehicles, microgrids, and other new technologies and services that was just beginning to show some potential in 2009 is well on its way to producing and benefits today. For example, customers are participating in making their own energy decisions in ways only imagined in the past; new models for ensuring grid reliability in this era of DERs are emerging, and forecasting models are being deployed to account for the granularity of smart meter data and the variability of DERs. As a result, traditional methods and metrics are going the way of the rotary phone and TV rabbit ears.
And of course, a utility’s ability to harness and manage this change while keeping the lights on in a way that is simultaneously affordable, reliable and sustainable, is the challenge that all of us in the industry are working towards.
The Global Utility Industry Study, recently completed by SAS Institute, explores how changes in the industry are impacting the ways that utilities deploy data and analytics tools and technologies. In the latter part of 2016, the SAS Institute Utilities Team initiated a global utility industry survey to explore how utilities are embracing analytics to help solve their challenges (which are arguably becoming more and more complex over time). Published in Q1 of 2017, that survey report provided a glimpse into the state of utility analytics.
Now in 2019, the SAS Institute utilities team has again conducted a survey of the global utility industry. This will provide a glimpse into how utilities continue to evolve in their use of data and analytics tools and solutions to solve today’s and tomorrow’s energy challenges. Where applicable and noteworthy, comparisons between the 2017 and 2019 results will be presented and discussed.[i]
The struggle is real, but so are the results
As suggested by this article’s title, the survey results do tell a story of progress, but this progress often comes only with a lot of bumps and bruises along the way.
The development, appointment, and use of Analytics Centers of Excellence, Chief Data Officers, Transformation Executives, and Data Governance programs continue to grow. These are the result of utility leaders realizing that their businesses are becoming increasingly digitally-driven and are moving deeper into the deployment of an investment in analytics. Traditional organizational models and skill sets are not meeting the complex needs of digitally-driven utility organizations.
Analytics is becoming a core part of a utility’s ability to execute on their mission. Over three-fourths of respondents report that analytics has changed the way they do business. One might surmise from this that as utilities become more data-rich, there is a growing realization that the path to value is analytics.
Open Source tools, both Hadoop for data storage as well as open source programming languages, are growing in their use. The challenge is leveraging these tools in a production environment and moving beyond the test or lab environments. Figures 1 and 2 below provide a glimpse of how analytics is changing a utility’s approach to business and how the tools that shape these changes are being deployed.
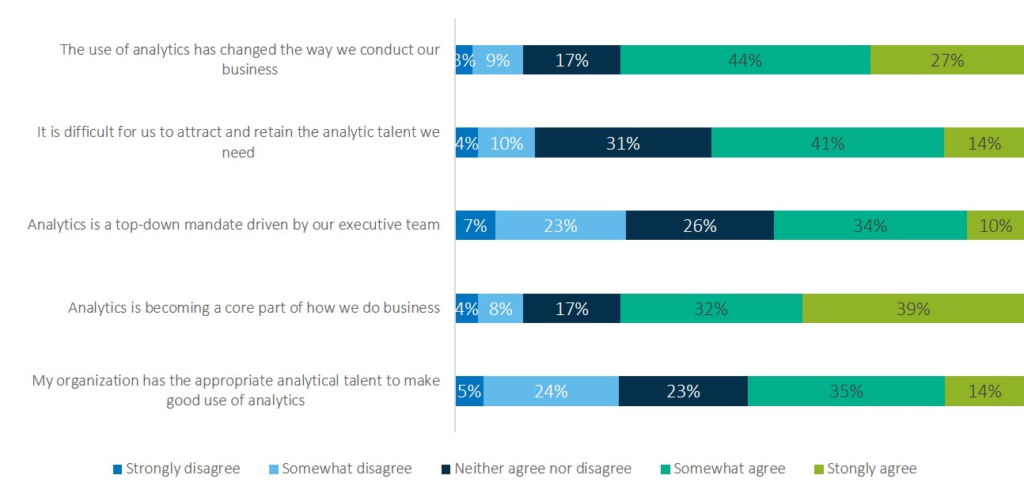
Figure 1. Please indicate your level of agreement with the following statements.
The utility industry continues to see analytics as a tool or solution to solve business problems across a broad range of use cases. Survey results this year see growth and emphasis in energy forecasting, customer segmentation, and customer program engagement.
Growth in these areas is not surprising. Energy forecasting becomes more complex with new data sources and rapidly shifting generation portfolios. Many utilities are making deliberate moves to put the customer at the center of everything that they do.
Survey results showed a decrease in smart meter analytics use cases and grid analytics, both of which are a bit surprising and merit further exploration. This could be the result of the mix of survey respondents, which does appear to have fewer T & D respondents this year. This might be the answer as the SAS Utilities Team reports growth in interest in the smart meter and grid analytics areas
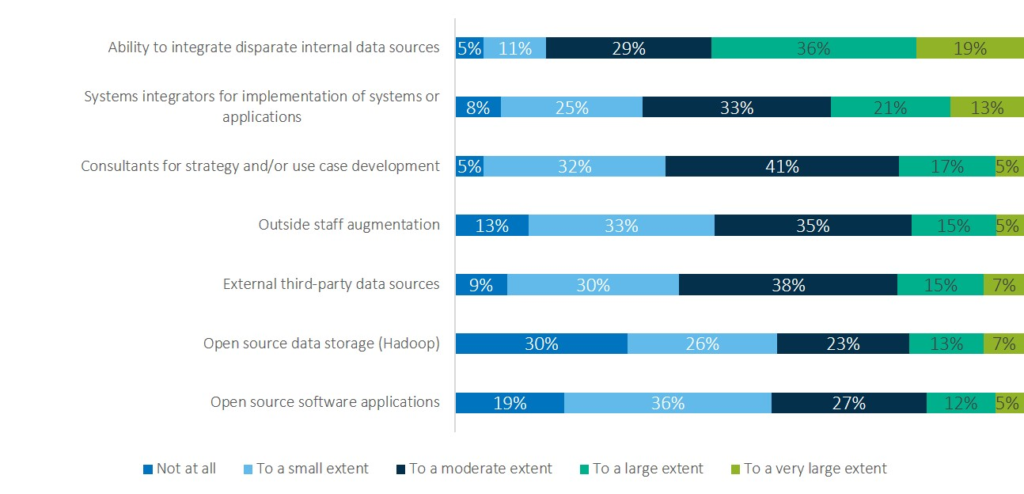
Figure 2. To what extent does your utility depend on the following for analytics initiatives?
The 2019 global utility survey is proof that the utility industry is indeed taking strides and realizing value with its use of analytics. With challenges that range from complex operations, stringent regulatory requirements, massive and complex data sets, and a changing customer engagement dynamic, the utility industry today is moving towards a model that will be barely visible from its recent ancestors.
Mike Smith is the Principal Industry Consultant in the utilities group at SAS Institute. He is a 29-year veteran of the utility IT, automation, smart grid, and analytics markets. He can be reached at mikef.smith@sas.com to request the full white paper with the survey results.
[i] Basic facts and survey methodology:
- Global survey conducted in English
- Survey conducted via multiple emails blasts to a global audience of 5,000+ global utility analytics professionals
- 162 unique, qualified utility responses (many were not included due to bad or questionable data)
- Two-thirds of responses are from large utilities with 1,000,000 metered customers
- 52% of responses are from outside of the US; 48% are from the US
- Top five country responses other than the US are: Italy, Portugal, Belgium and (all tied) Australia, Canada, South Africa and the UK