How Duke Energy is gaining insight from self-organizing maps, a form of deep learning.
Duke Energy has a reputation for deploying analytics to solve business problems. The Data Science role at Duke was defined in 2014, with the first Data Scientist hired in 2015. Duke Energy now has over 80 data scientists across the enterprise. One senior data scientist, Miguel Sanda, has been exploring how the self-organizing maps (SOMs), unsupervised deep learning algorithms for pattern detection, can provide value to utilities.
What is deep learning?
Deep learning is the least mature of AI techniques. Researchers are at the tip of the iceberg in knowing its potential and implications. Few companies, utilities included, are deploying deep learning widely.
Karen Hao in What is Machine Learning[1] defines deep learning as “machine learning on steroids: it uses a technique that gives machines an enhanced ability to find—and amplify—even the smallest patterns. This technique is called a deep neural network—deep because it has many, many layers of simple computational nodes that work together to munch through data and deliver a final result in the form of the prediction.”
SOMs use competitive learning where neurons in a neural network compete. The idea is to feed data into the algorithm and let the SOM reveal patterns. The result is a map where the distance between clusters measures differences. Classification algorithms help identify outliers and “things you should look at, that you may not even have thought to look at before.” See the topology matrix below.
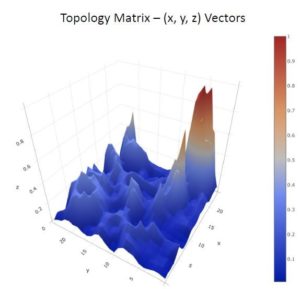
Source: Leveraging AMI and The Self Organizing Map (SOM), Utility Analytics Institute, May 2019
Power quality characteristics emerge
At Duke, Sanda applied SOM to a poll of AMI meter events triggered by conditions at the meter. AMI data included min, max, and average voltage and VARs and watts. Transformer KVAs, temperature, latitude and longitude were also part of the analysis. The next question was what to do with anomalies identified by the SOM.
That’s where use cases came in. Sanda had several in mind, but settled on momentary outages, which can be a real problem for customers and utilities. Momentaries lower power quality. Poor power quality can be an issue for equipment. However, most customers don’t notice when momentaries occur, or if they do, that there is a reason to investigate.
What could be learned by associating the characteristics of anomaly customers with actual momentary outage maps? The team pulled SOM anomalies and overlaid actual outage locations to find characteristics associated with momentaries. Digging deeper, distribution engineers conducted on-site inspections, installed power quality meters, and took corrective action.
Power quality meter data and investigation validated the SOM results. In one instance, the team verified an abnormal voltage drop on a long feeder. In another instance, a loaded neutral on a sewage pump created billing errors. More importantly, if the pump failed due to this condition, there would be an adverse environmental impact. In a third example, a billboard was experiencing large voltage swings. Investigation revealed an undersized secondary[2].
Words to the wise
For analytics practitioners who get to experiment with AI tools, here is what to consider:
Include domain expertise on the team. According to the team lead, “AI is meaningless without domain knowledge.” Duke was fortunate to have Sanda’s skills as an engineer and data scientist. Those skills in one person are rare, so be sure that your exploration team includes both.
Make validation a part of the process. Sometimes the application of analytics delivers results that appear to defy the laws of physics. Utilities run critical infrastructure, so skepticism is healthy. That’s why validation is a necessary step, not just at first the first use of a tool, but on an ongoing basis for subsequent experimentation.
Re-assess what data is critical. One of the lessons learned in this exercise was that there is value in collecting granular voltage data from the AMI meters. There are not many instances where AMI meters are set to collect voltage data. The meters in this sample did. With more granular data, there is an opportunity to discover what might be missed otherwise.
[1] The article also has a great flowchart describing where deep learning fits into machine learning.
[2] Investigators also found that the time clocks on the billboard were off. Half of the billboard was list at night, the other half during the day.