
The increasingly dynamic nature of the grid means platforms need to handle all aspects of the analytic modelling process in an integrated and seamless fashion to rapidly get from analytical model development to business decision-making.
The proliferation of Distributed Energy Resources (DERs), such as rooftop solar and battery storage, brings significant challenges to grid management from a day-to-day operational perspective due to resulting non-traditional load shapes such as the duck curve. Additionally, medium- to long-term infrastructure planning is made increasingly complex because of the need to incorporate the seasonal and time-of-day impacts of DERs on load, and in determining the types and geographical placement of infrastructure investment required. The projected growth in electric vehicle (EV) adoption by consumers, as well as with fleets in the transport sector, further increases this complexity.
Aging infrastructure, exacerbated by the effects of climate change, negatively impact system reliability and safety. This is evidenced by the wildfires in California caused by poor maintenance practices, and the more frequent occurrence of “once-in-a-hundred-year” events such as hurricanes on the U.S. Gulf Coast, and the recent winter-storm related blackouts in Texas. As a result, reliability metrics such as system average interruption duration index (SAIDI) and system average interruption frequency index (SAIFI) for U.S. utilities have not shown marked improvements over the last decade.
And what about customers? More customers are demanding more control over their utility bills and more accountability from utilities as they adopt technology such as smart thermostats. To-date, the investments in advanced metering infrastructure (AMI), originally thought to be a key piece of utility-to-customer engagement, have not resulted in appreciable improvements in the customer experience for North American end-users. Residential Demand Response (RDR) that could truly impact consumer behavior and utility bills is largely in the pilot. The Covid-19 pandemic, and the resultant shift to remote/work-from-home on a large scale, will result in changes in demand patterns and infrastructure impacts in dense urban cores, and an expectation of more reliable, low-cost energy in the residential context.
So, given the myriad of changes in this new energy environment, how should utilities react to these external pressures and potentially disruptive forces? The obvious answer may be infrastructure modernization. Grid modernization, while a necessary part of the equation, will not come fast enough to satisfy consumers and regulators. In addition, it is unlikely that the cost of massive infrastructure spending will be passed on to consumers in the short term, especially in the context of the current post-Covid economic outlook. A viable alternative that utilities can adopt to meet these challenges is to harness the massive amounts of data that are already being collected, pairing that with advances in computing power and deploying analytics such as artificial intelligence (AI) and machine learning to deliver insights for decision-making.
One place to start in this analytic-driven journey is with a utility’s asset and maintenance management practices. As an industry, electric utilities have established asset and maintenance management practices that have been in place for years or even decades. Asset maintenance and upgrades are typically time-based, often with a standard operating procedure of run-to-failure. Looking at other industries, we in the utility industry need to ask ourselves why we aren’t embracing asset and maintenance management practices that are more preventative, predictive and prescriptive. The answer to this question is debated ad infinitum, so let’s assume that there is a business benefit for moving towards more predictive asset management (because there really is!). The utility industry is now at a tipping point in relation to its asset management practices: the availability of data and computing power is tailor-made for a big shift to predictive asset management. The data from sensors on assets, load data (leveraging that smart meter data noted above) enriched with asset characteristics and weather information provide insight into when, where, and why failures occur and how to prevent failures in the future.
A second area of opportunity is forecasting infrastructure needs as the grid evolves over the coming years. Transmission and distribution assets are connected within a dynamic grid network hierarchy. Identifying where to make cost-effective upgrades and repairs requires a more granular lens. We see the industry recognizing the need to go from a “top down” forecasting approach to one that is “bottom up” in order to capture the granular changes in the grid that will impact reliability in the near- and long-term. No longer will sweeping macro data sets suffice to provide these insights down to the circuit level. Utility leaders need to recognize–and many do–the need for a net load forecast that starts at the circuit level and is the foundation for distribution and capital asset planning in their integrated distribution plan. Net load forecasting requires the load data from thousands or even millions of assets along the network hierarchy and the existing and planned DERs. Forecast adoption rates of electric vehicles and solar photovoltaic systems need to reflect continuously changing customer behavior and emerging technologies.
The common thread across both grid and asset reliability, and net load forecasting, is the massive data “underpinnings” that enable utilities to successfully make decisions in this challenging, dynamic operating environment; this calls out for utilities to have a robust, open, scalable data analytics platform in place that provides the capabilities and advantages to safely and economically keep the lights on as the pace of change on the grid accelerates. The decision-making platform needs to be flexible, scalable and open. The call for granular insights to ensure that the lights stay on is real and is NOW.
The increasingly dynamic nature of the grid means this platform needs to handle all aspects of the analytic modelling process in an integrated and seamless fashion to rapidly get from analytical model development to business decision-making. Key steps in the process are:
- Model development – It should cater to both open source developers as well as those that wish to use a proprietary language. For no-code citizen data scientists, it should provide a variety of modelling techniques ranging from regression to neural networks in a drag-and-drop interface.
- Model Testing – It should provide an easy way for modelers to test and compete various models to determine the best fit for a particular analytic use case and identify the champion and challenger models. Model testing is an area that traditionally requires significant time and effort.
- Model Governance – Executives need to understand why models are providing the insights to be used in making decisions that impact the bottom line, safety or customer perceptions. The best analytic platforms provide model explainability that allows modelers to generate English language explanations of their models at the click of a button. In addition, organizations must track the lineage of all models – who developed or modified them and when, as well as where these models are being used to make business decisions.
- Model Deployment – For models to have value, they need to be deployed in front-end applications that are used to make business decisions. A model is rarely useful without some kind of business logic wrapped around it, so this handoff from modelers to IT is typically fraught with problems and delays because of re-interpretation of what the actual business result needs to be. An analytics platform should enable one-click deployments of new or modified models; it should enable business teams to adjust the logic around the model so that IT resources can simply work on accessing the decisions (models + logic) as services and not have to re-interpret the business intent for the production deployment.
- Continuous Assessment – Because data changes over time, the performance of models will drift over time as well. Analytics platforms need to continuously monitor model performance and alert relevant personnel when model drift is detected, so that they can be re-tuned or replaced with a new “champion” model. Also, simply determining the mathematical performance of a model is not enough–the decisions being made with the model also need to be continuously assessed to ensure they are delivering the business value that was initially expected.
The graphics below contrast the relative business value derived from analytics with and without the use of a robust integrated analytics platform.
Figure 1 – No enterprise analytics platform
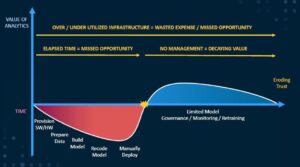
Figure 1 (above) depicts a long time-to-business value because it takes a long time to develop, test and deploy models. Once deployed, initial business value gains begin to decline and confidence in the analytical insights erode, in the absence of systematized model monitoring and retraining. In a worst-case scenario, business decisions continue to be made based on inaccurate results.
Figure 2 – Leveraging an enterprise analytics platform

Figure 2 (above) depicts the faster time-to-value and higher sustained, analytically driven business value gained from adoption of an analytics platform. This is first due to the shortened model build, test and deploy cycle enabled by the platform. Second, the platform provides for systematic and automated model management, continuous monitoring to detect drift and retune or replace, and the ability to incorporate models into decision-making flows at scale. The end result is faster time-to-value, confidence in the analytic insights, rapid data-driven decision-making and increased, sustained business value.
As the brief examples cited in this article demonstrate, the utility industry is in the midst of a multi-year pivot that demands new skills, new business processes and, in some cases, an entirely new approach to how the business is run. Utility leaders are now realizing that data is at the core of this shift, and that data is a valuable asset that needs to be managed and leveraged for maximum benefit. An analytics platform that is open, scalable and reliable is no longer “nice to have”; it is a critical business imperative that will allow utilities to not only deliver reliable service, but stay viable and relevant as the challenges in the utility landscape accelerate.
Mike Smith works in the global utility industry marketing group at SAS, head quartered in Cary, NC; he can be reached at mikef.smith@sas.com. George Mathew leads SAS’ Customer Advisory team for Western Canada and has worked extensively with U.S. and Canadian utilities and oil and gas companies; he can be reached at george.mathew@sas.com.