Utilities can combat climate change while enhancing their own service operations and bottom line by leveraging data from graphics processing unit (GPU) systems for next-generation GPU-accelerated analytics.
Climate change is a growing concern that needs every available tool that’s capable of helping combat the trend – and geospatial data and analytics are increasingly recognized as powerful tools in that arsenal. Today, utility companies find themselves in a unique position to help. That’s because the big data technologies that now provide safe and reliable services to customers, can also help organizations to solve some of the biggest climate change risks facing the world today.
Let’s explore how, by leveraging data from graphics processing unit (GPU) systems for next-generation GPU-accelerated analytics, utility companies can combat climate change while enhancing their own service operations and bottom line.
Climate Risks and Utility Operational Challenges Often Intersect
Most of the central service-related challenges for utilities also are huge climate change priorities in need of resolution. Rising temperatures from climate change are creating widespread, often sudden changes in weather patterns, such as heat waves, droughts, flooding and ice storms. In the short term, these events greatly affect energy demand and service provision. Over the longer term, they have widespread effects on both assets in the field and vegetation around them. Some of the most impactful areas where these utility industry and climate change priorities converge are energy demand prediction and management, weather tracking and vegetation management for fire risk mitigation.
Disaggregate modeling of energy demand is fundamental to grid modernization and decarbonization. By some recent estimates, electrification is the single largest and fastest available tool for climate change reduction. In some of these scenarios, we will need to increase our overall grid capacity by roughly 4X. Of course, the grid will need to be smarter as well as bigger in order to effectively deploy solar, wind energy and battery storage.
Experimenting on our live production grids is not normally desirable, so this business requirement is for large improvements in the ability to simulate future network alternatives. Here we run into a second new business requirement, which is that we are designing for a very different world. In addition to the technology changes noted above, our future grid will be operating under very different weather and climate conditions, and this in turn will profoundly affect the vegetation around it.
Planning for a Changing World
The most immediate consequence of climate change on utilities is that historical data and projections based on it are in urgent need of scrutiny, and often revision. An important related concern is the ability to monitor and respond more quickly to changes.
Consider, for example, the tactical planning required for a public safety power shutoff (PSPS) or fire event. The very concept of proactively shutting off power to customers is new, but so are current fireline intensities and fire spread rates. Tracking weather patterns closely allows anticipation of service interruptions and prepositioning of crews and other resources for quick restoration of those services.
The value of accelerated geospatial data analytics solutions in tactical planning is to ‘get ahead’ of the weather through nowcasting and forecasting. This is obviously time-sensitive, in that perfect information one hour too late isn’t useful. Increasingly, confident forecasting requires running and comparing multiple weather models, each instance of which is already large. Doing so nimbly and interactively requires not only high performance computing, but also high-quality visual analytics tools.
Climate data also increasingly drives capital expense budgeting for equipment replacement and upgrade projects. In the context of aging infrastructure and unprecedented climate conditions, utility equipment is commonly operating beyond its design lifetime and under environmental conditions that exceed its original design specification. In this case, planning horizons are much expanded. However, the volume of data that needs to be considered is much larger. Rather than considering a 3-10 day forecast, the analysis of equipment weather exposure typically requires years of data. This also is an important area for scenario planning because a large number of projects need to be organized and coordinated while one considers various limited resources.
While the technology and granularity of analyses of the tasks above is new, those challenges are broadly familiar to utilities. However, the practice of vegetation management is perhaps undergoing the deepest transformations. On the one hand, this is due to major improvement in the quality of vegetation data that can be obtained at scale.
A decade or so ago, the best available information might be 30m resolution data, which took two years of hand processing to update. Today, automated data pipelines can process vegetation data at orders of magnitude higher resolution and perform near-continuous observation. With current multispectral satellite imagery, for example, it is possible to detect insect infestations likely to cause tree death up to two weeks before such damage is visible on the ground. These new capabilities support monitoring across vast areas, but with sensitivity to health of individual trees.
At the same time, however, utilities are experiencing types and rates of change in vegetation conditions that historical methods are unable to keep up with. For example, during the latest California drought, 120 million trees perished. Many of them are not coming back because climatic conditions have shifted. Not all of these trees were adjacent to power lines, but certainly enough of them that automating “strike tree” analysis is a high priority at many utilities. Such issues are by no means limited to California. The U.S. Northeast, for example, is experiencing major forest transformations, as well.
Vegetation management is a complex operation that needs to be coordinated over vast expanses of land. The kinds of changes noted above cause a major challenge to traditional field-based methods and statistical analytics. Essentially, the default is a large amount of hidden risk. Historical conditions are no longer representative of current or future conditions, and the granularity of these changes can exceed ground crews’ ability to survey and respond. Meanwhile, lower-resolution and slowly updated datasets hide risk within spatial or temporal aggregations. The solutions to these challenges require new techniques, such as the building of robust automated data pipelines and the use of data science models. Again, better data and analytics can reap powerful gains against such risks.
Unfortunately, utility companies trying to cope with these challenges often are outmatched as they struggle with antiquated procedures for utility asset management. Paper maps and documentation may be outdated or imprecise, forcing crews to be more reactive rather than proactive with field maintenance. While GPU analytics adoption is catching on somewhat, the problem is that many current GPU approaches involve software platforms that are not advanced or powerful enough to integrate and compute the required data, which is often incredibly detailed and extensive in its spatial scope.
Solving Critical Use Cases with GPU-Accelerated Analytics
Fortunately, utilities are increasingly able to benefit from analytics that leverage new and enhanced datasets, analyzed with advanced computational tools and techniques. Geotemporal data and predictive GPU-accelerated analytics play a critical role in mitigating the combined environmental and utility asset management risks discussed earlier – lessening the impact of these events and even preventing some instances altogether.
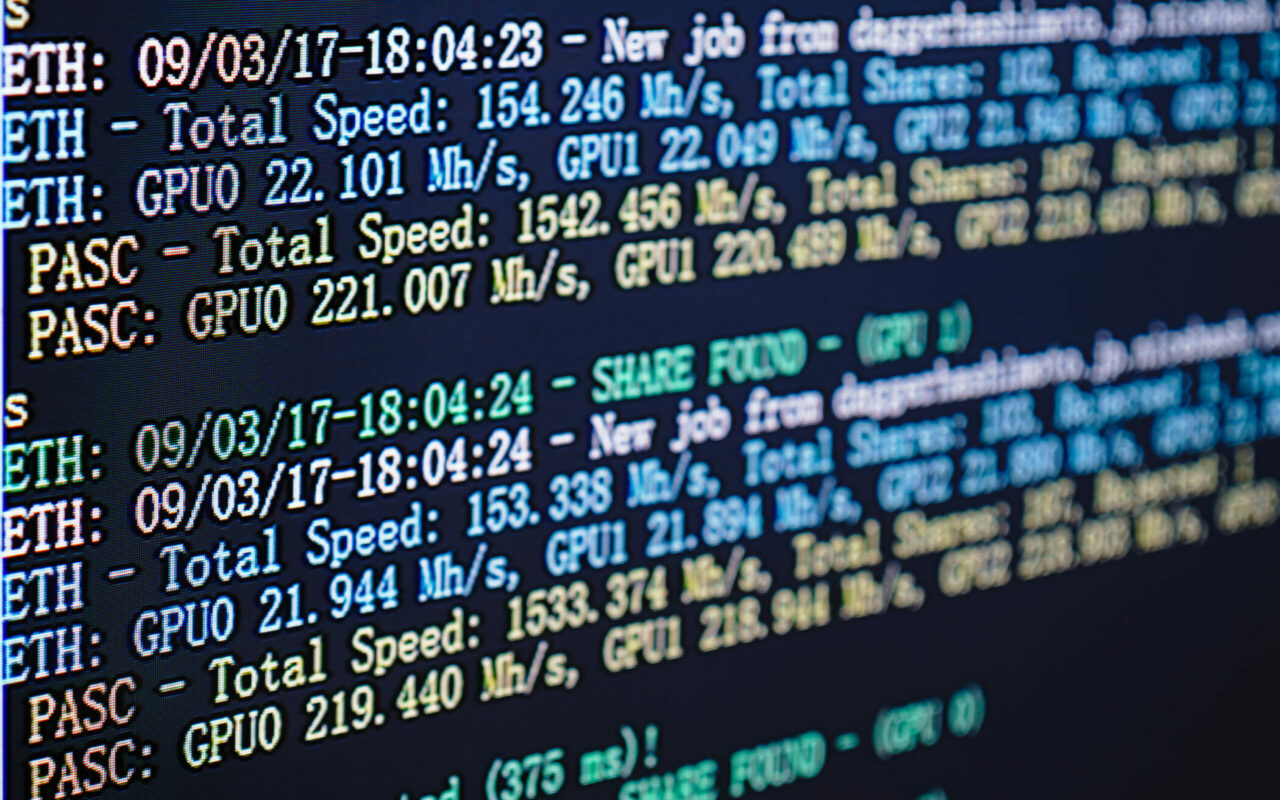
Since GPUs are programmable processors designed to quickly render high-resolution images, they excel at performing parallel operations on multiple sets of data. That means they can be adapted for non-graphical uses, so that GPU computation power can be positioned to analyze massive amounts of information and return results in milliseconds. Automated data pipelines and machine learning continuously update risk models that are critical for prioritizing mitigation activities. Also, real-time, near-term forecasts can help with prepositioning assets and gaining frequent updates on current conditions that can save lives and property during a natural disaster.
Let’s return to those three specific problem areas – demand projection, weather tracking and fire risk mitigation through vegetation management – to see how these solutions play out in these particular settings.
- In terms of demand simulation, the most important benefit of using GPU acceleration is improvements to simulation accuracy from disaggregate modeling. Historically, building energy demand models have had to assume generalized models of consumers and of buildings. Similarly, travel demand models have used large spatial zones. With the combination of smart meters and remote sensing, we now have vastly better empirical data compared to the few dozen archetypical buildings used in conventional models. For example, we routinely simulate every building in the U.S. (~120m). With GPU acceleration, we can use open LIDAR (light detection and ranging) data to measure the height and roof geometry of every building in a city within a few minutes. We also have a new generation of high-resolution thermal imagery, which allows us to measure aggregate heat profiles, even for areas without smart meter data. Similarly, we have literally billions of cell phone pings, which show us activity levels across the country for any time of day or day of the week.
The proliferation of data sources of these kinds, commonly known as “big data,” combines with demand modeling in many different ways. But it is hard to deny big data’s fundamental importance. Even small improvements in energy demand prediction can lead to important efficiency improvements. Such data is mission critical to achieve the enormous reliability planning challenge of time-varying and location-varying energy generation and consumption. Yet without technology planning, big data can easily overwhelm traditional computer hardware and software.
- A well-designed GPU-accelerated analytics platform can help manage massive volumes of weather information to extract decision-quality insights and real-time visualizations that will help guide decisions around asset placement and disaster response. For one major utility, we are currently designing a system that supports interactive visual comparisons of three major external weather models with their in-house predictions. In addition to the visualization of weather data per se, this system uses GPUs to perform interactive geoenrichments for every building and utility asset in their service territory. For example, we can look at forecast temperatures on any particular circuit three days ahead and determine how many assets or customers are likely to experience any particular temperature threshold.
- In a fire prediction and management context, simulation speed is critical. GPU analytics can serve multiple use cases. For example, large utility-initiated wildfires tend to be correlated with the square of wind speed. So in long-term planning applications, a utility can analyze prevailing winds or fire-weather wind scenarios to help prioritize equipment upgrades or even undergrounding projects. In terms of vegetation management, utilities equipped with GPU-accelerated analytics can predict and pinpoint where dead trees are most likely to come into contact with power lines (“strike tree analysis”). And within a short-term current and predicted weather event, the same risk analytics can be used for streaming wind data for PSPS event response.
Getting Started
As the examples above indicate, analytics acceleration can benefit many business units within a utility. In our experience, initial pilots and deployments often are initiated at the business-unit level. That is fine, as long as the economics of the specific application justifies the approach. However, in a pattern similar to the history of GIS, advanced analytics ultimately benefits from economies of scale when applied across departments.
Utilities have some competitive disadvantages; one example is obtaining data science expertise within a highly competitive labor market. However, they have some advantages as well. A critical one is that because they do not typically compete directly with each other, it can be easier to share knowledge across utilities. So while the topics addressed here are relatively new, we encourage you to share your experiences and questions with others across the industry, and the Utility Analytics Institute is a terrific forum in which to do so.
While addressing and responding to climate change is a tremendous task, the good news is that the required data are readily available and new technologies leveraging GPU-accelerated analytics can make a big difference. Utilities are a mature industry, but one that is about to experience a rate of change unprecedented in recent history. Building an organization that is ready, willing and able to deploy advanced analytics is ultimately essential for utility customers, as well as of enormous global importance.
Dr. Mike Flaxman is the product manager at HEAVY.AI.