
One of the most common questions utility clients ask is, “How can we identify our disadvantaged customers and tailor our services to meet their unique needs?” As state legislatures, regulators and investors call on utilities to improve energy equity, pursue environmental justice and ensure a fair decarbonization transition, answering this question becomes ever more important. There is a growing need for data-driven strategies and tools that empower community stakeholders and focus resources on those most in need without compromising customer confidentiality.
DNV has developed an interactive mapping tool that is designed to help utility programs conduct targeted outreach. This simple, platform-independent tool identifies geographic areas with high concentrations of two or more variables (for example, renters and low program[1] participation). Utilities and program administrators can use this information to better understand the demographic profiles of areas that have low participation. They also can use it to assess how well their programs are reaching various populations, including disadvantaged communities and environmental justice populations, and to make program and process adjustments where necessary, such as modifying marketing strategies and communications.
DNV’s mapping tool also facilitates cooperation between utilities and local partners such as community action agencies and municipalities. The maps allow a utility to share participation data with local partners while protecting the personal identification information (PII) of its customers. This is important to incorporating local, trusted community members into the program delivery process in order to facilitate communication and help champion the programs.
Local agencies and municipalities often know more about the people and the places where they live and work than do the utilities. These agencies are familiar with the stakeholders and the unique local imperatives that impact customers day-to-day outside of the utility service mandate. This includes cultural considerations such as languages spoken in the area and specific areas of the town that would most benefit from participation. For example, the Massachusetts Program Administrators are using DNV’s tool as they work with their municipal partners to identify ways to increase trust and program participation in vulnerable communities.
How DNV’s mapping tool works
DNV’s mapping tool combines utility tracking data, billing data and open-source demographic data (from sources like the American Community Survey or state-wide tax assessor data) to place informative overlays on top of the Google maps. The overlays provide a visual cross-tabulation of demographics and participation data (see Figure 1).
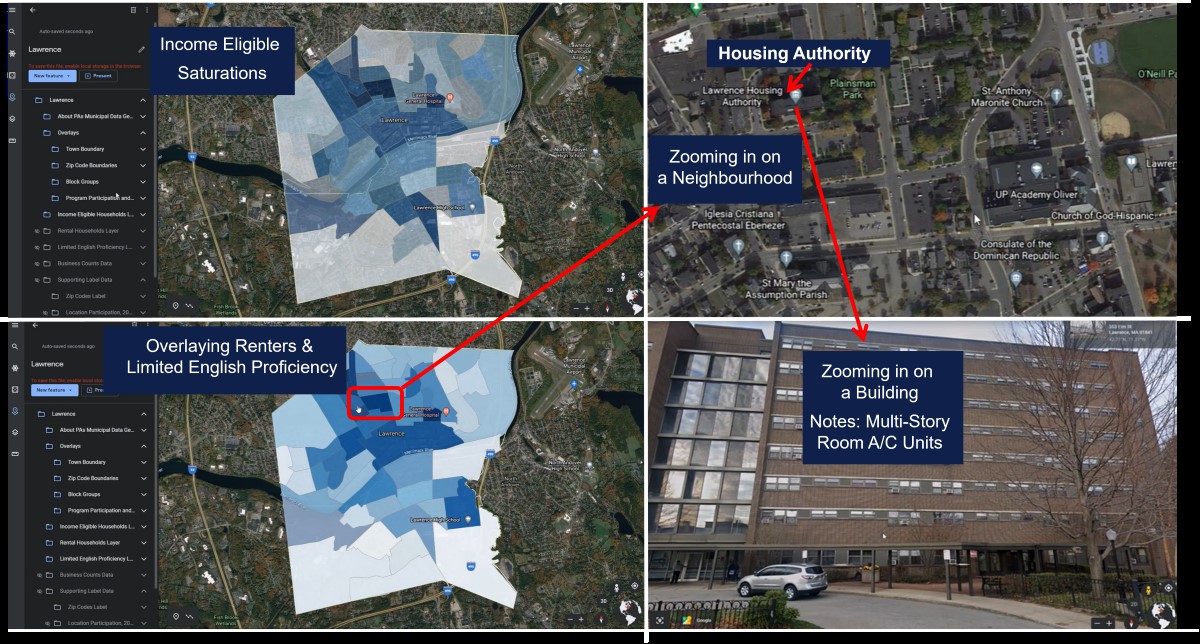
The tool allows utilities and trade allies/partners to home in on areas that contain approximately 200 households. After choosing an area of focus, users can get a better understanding of the area by using Google Maps information. For example, users can identify landmarks or gathering places that might be used for setting up community outreach or workshops. The tool also integrates with street views so users can take a virtual tour of the area in order to understand what it looks like and, in some cases, to identify potential measures to discuss with a property owner.
Key features of DNV’s mapping tool include:
- The tool is accessible on any device that can run Google Earth or Google Maps.
- All information available in Google Earth and Google Maps is available through the tool interface. This includes satellite and street views, landmark identification, and business hours and contact information. It provides a seamless way to leverage the wealth of data that Google captures about businesses and communities.
- The tool provides visualizations of participation rates and demographic data while protecting utility customers’ PII.
- The tool flexibly integrates with geographic information systems.
DNV may add features for transportation electrification, such as distance from major landmarks, to help with the siting of electric vehicle charging stations. A brief video demonstration of the tool is available at this link.[2] The tool can be custom branded and is re-directable to a utility or program administrator’s service offering.
Author: Dr. Shawn Bodmann, Director Energy & Climate Equity. If you’d like to contact Dr. Bodmann please send him a message.

[1] Programs include energy efficiency, demand response, bill payment assistance and other customer-facing initiatives.
[2] https://brandcentral.dnvgl.com/mars/embed?o=35ABE24DD88CA605&c=10651&a=N