
Utilities are undergoing an unprecedented transformation due to changing generation technologies, the introduction of energy storage systems, distributed energy resources and major shifts in load due to electrification. These challenges are occurring simultaneously with the introduction of sophisticated new technology systems and tools designed to aid in specific processes.
The all-important controls needed to run a utility’s operation generate large amounts of data that provide operators and managers with the information they need to make decisions or detect when problems may occur. This data must be accurate, timely and easily accessible.
However, many utilities commonly face challenges stemming from the fact that different pieces of the data puzzle live in different system silos. They can include enterprise asset management systems (EAMS), asset monitoring systems (AMS), enterprise resource planning systems (ERPS), supervisory control and data acquisition (SCADA) systems, and many others. This situation poses many challenges, including:
- The same data often stored in multiple systems where changes may not be propagated. (This makes it difficult to determine the source of “truth.”)
- Difficulty in accessing and sharing data across different departments or functions that utilize disparate systems.
- Inability to see big picture trends within the entire power generation and/or distribution system.
Graph Database Technology
Graph databases are an emerging technology that can address the challenges that utilities and many other types of organizations face due to increasing volumes of complex data generated by disparate systems. Graph databases store and manage data in nodes and the relationships between them. It goes further than traditional relational databases because the relationships are just as important as the data itself.
The graph database is a significant advance in data modeling that accounts for common characteristics that form the complex relationships between the entities represented by the data. As stored data is linked together, users can retrieve desired information from a much richer and deeper pool with the flexibility needed to perform dynamic data modeling.
Graph databases represent a marked departure from traditional relational databases, which are optimized to minimize storage while ensuring referential integrity. Relational schemas often have limited, inflexible relationships, seldom matching the mental models of the applications they serve. With the use of graph databases, the schema that maps the different types of nodes and relationships is intuitive and flexible, easily representing complex relationships like the ones that arise when integrating data from multiple systems.
For example, the relationships between a utility’s work orders logged into an EAM and invoices logged in the ERP system can be tracked in a visual representation. A graph database solves a basic problem with database management because it allows the user to search for patterns. How is this asset connected to another? How is this work order connected to that abnormal temperature alert? The graph model finds the possible paths where nodes may be connected.
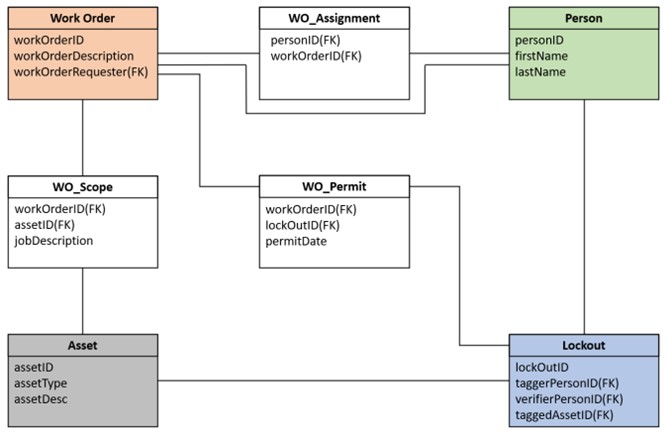
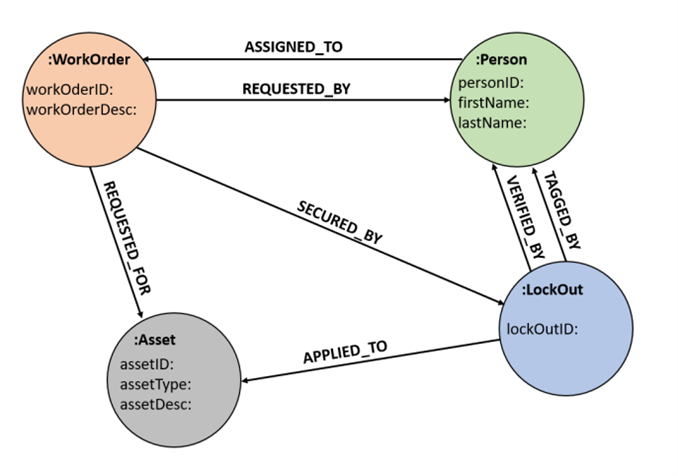
Figure 1Work Managementdomain – Relational vs Graph Model
Evergy Graph Database
In an ongoing project with Evergy, graph database technology is used as a glue to bind data silos together. These data repositories are like those found in most large electric utilities, providing the basic information for system controls and day-to-day management.
The project is focused on aiding the Monitoring and Diagnostics (M&D) process, which relies on data from multiple systems to prevent, identify and troubleshoot equipment failures.
These many systems represent aspects of the M&D processranging from information about assets, work orders, financials, HMI screens, engineering documents, instrument readings, alerts and predictive models, all previously living in their own data silos.
A single, intuitive model of these sources simplifies data gathering for diagnostics, planning and work management. The graph model can be seamlessly used for and with commonplace business intelligence (BI) ? tooling to bring previously disparate data into one screen, enabling the M&D team to see new patterns and act on them.
Bridging the gap
Graph Database Technology has enormous potential as a master data management system. It can serve as the ultimate source of truth to determine where data originates among various disparate data silos.
Once the graph database is built, it begins to take on properties that arise from the structure of complex systems that graphs represent and are common when modeling data from disparate sources. Because anything can be represented as a graph, and because graphs can bring improved data quality and consistency (backed by the ability to query and traverse across many sources), graph databases are leading to a new era of insight needed by managers who are running increasingly complex organizations.
Manual Zubiaur Carrasco – 1898 & Co.
Manuel is a data scientist with a diverse industry background. He has experience in graph theory, machine learning and mathematics, which has helped him develop a strong understanding of how data works. He uses this experience to help businesses merge data sources and internal process to find ways to improve their operations, bringing together disparate sources to form concise storytelling for manufacturing, engineering, construction and pharma marketing. Manuel is tool agnostic and has worked with the most popular BI platforms: Tableau, PowerBI, Qlik Sense and others. He has worked with cloud architectures, ETL tools and automations needed to bring together end-to-end analytics solutions.
When you need to interpret data, build intelligent dashboards or anticipate challenges ahead, you need a partner who can help — within the context of your industry. Learn how our significant industry experience in analytics & business intelligence means we deliver data and intelligence that is useful, intuitive and actionable.