One of the most important functions of an electric utility is to safely provide reliable and dependable power to its customers. This obligation includes building redundant circuit paths, insulating conductors, installing animal barriers, installing switches and reclosers, trimming trees and maintaining aging equipment to name just a few of the myriad of tasks involved. Unfortunately, no matter what a utility does to harden the grid, stuff happens. These issues, known as anomalies, are when something occurs that deviates from what is standard, normal or expected. Figure 1 below highlights several anomalies in the forms of “acts of nature” and uncontrollable events that occur despite the best efforts of utilities.
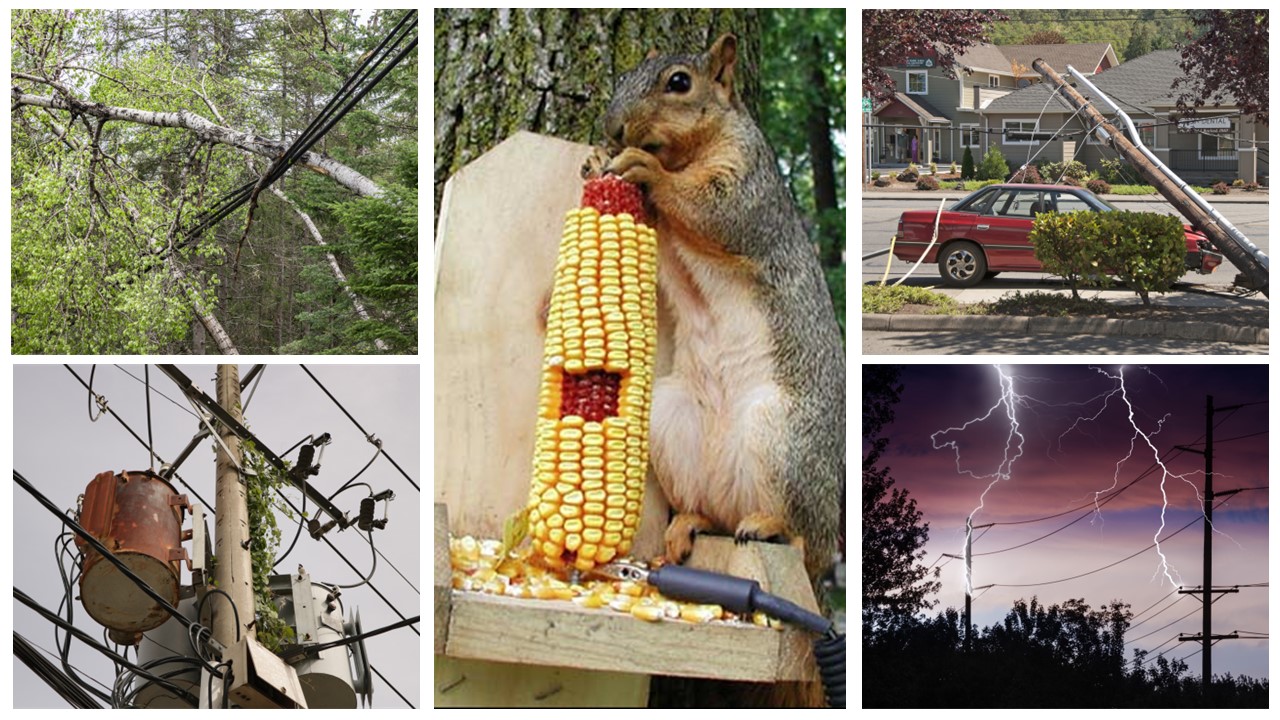
Figure 1: Causes of Grid Anomalies
When these events occur, it is important to identify the location of the event and rapidly respond to mitigate any consequences of the event. This mitigation effort has recently come under intense scrutiny from the public because of the potential for starting a wildfire in tinder dry, drought-stricken areas of the western USA, Canada and most recently, the Hawaiian Islands.
Detecting Anomalies
Surprisingly, many of these events are challenging to detect because they occur in remote, difficult-to-reach areas and/or create dangerous electrical arcing conditions that are not severe enough to open fuses or trip safety systems designed to mitigate the results of the event. To respond to this challenge, an entirely new industry has developed around Fault Condition Indicators (FCIs) that can be deployed on the primary circuits of the distribution network to monitor currents, voltage and waveforms. While FCIs are able to successfully identify fault locations, they can be difficult to deploy because of the line current requirements for power harvesting. Moreover, the quantities installed are limited due to physical challenges installing FCIs, especially in remote locations.
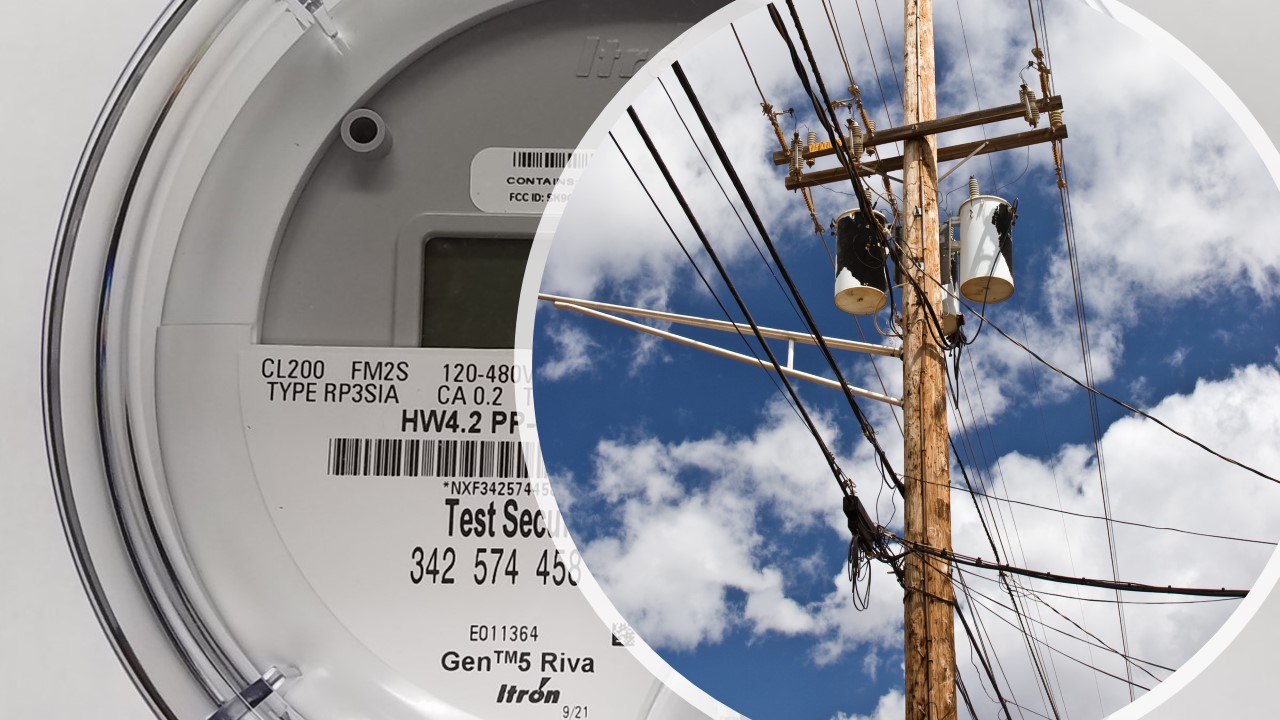
As an alternative, Itron’s distributed intelligence-enabled meters now include waveform capture from four-to-32k samples per second. Combined with the ability to download custom agents to the mass deployed smart meters in a service territory, these Itron’s smart meters have the potential to detect grid anomalies rapidly and accurately. Also, due to the typical density of smart meter deployments, it is possible to determine the extent of the event and categorize whether it is a local, regional or even global grid-wide event.
The Challenge: Bandwidth and Physics
Itron’s distributed intelligence-enabled smart meters are capable of sampling grid voltages and currents up to 32,000 samples per second. Sampling at this rate, however, may generate 1,382,400,000 bytes per hour1 per meter. This is clearly too much data to return over an RF mesh network or to manage and process centrally across up to millions of meters. The alternative is using distributed intelligence (DI), and its ability to process these waveforms at the edge, to detect an event and deliver only the relevant event data to the utility’s back office.
Anomalies are detected by observing minor distortions in the shape of the voltage waveform. Figure 2 shows the shape of a typical 60 Hz AC waveform. The shape of the voltage waveform is derived from the large turbine/generators at the generating stations that pass a rotating coil of wire between the poles of a magnet. By applying various statistical functions to the sampled waveform, any ½ cycle that deviates from a “perfect” AC sine wave can be detected, recorded and alarmed appropriately.
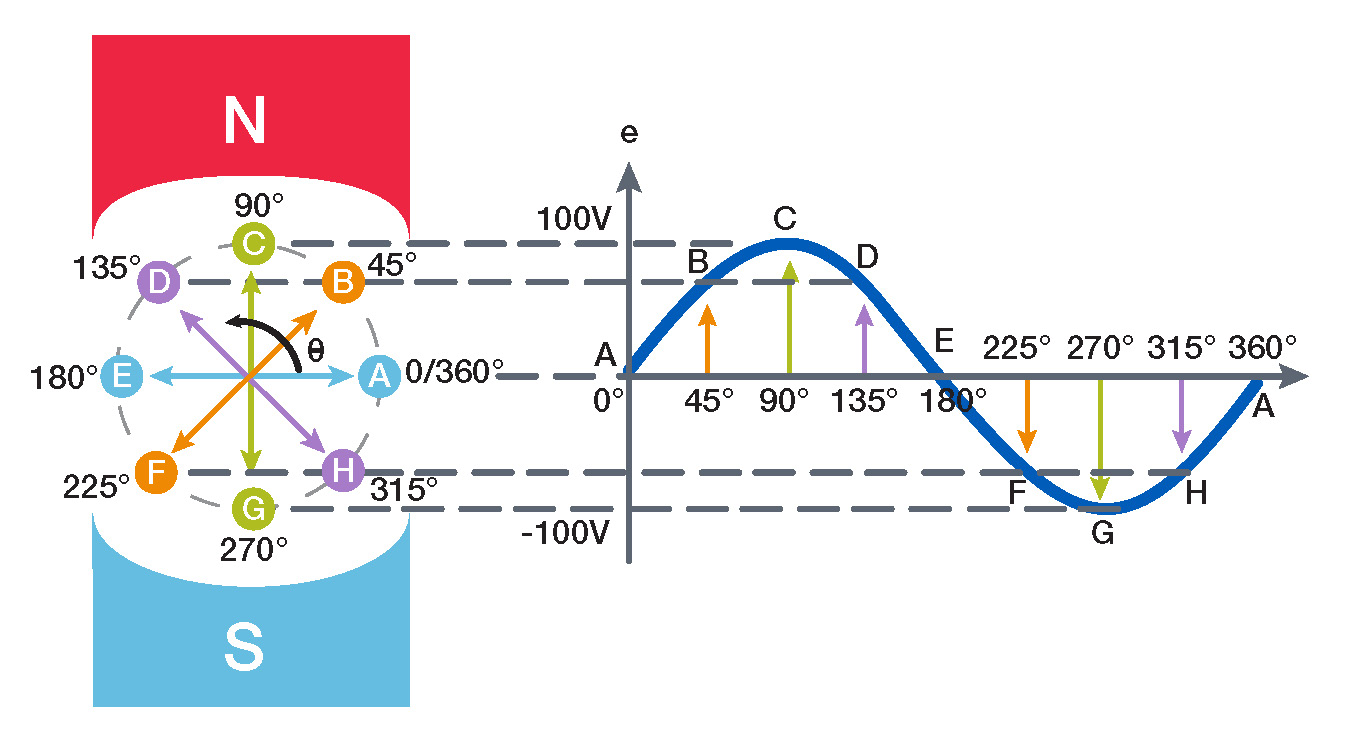
Figure 2: AC Voltage Waveform Generator [1], [2]; Image created by Itron.
The Math: Crest, Skew, Kurtosis
At the highest level, the anomaly agent examines every ½ cycle of the sampled voltage waveform calculating the Crest, Skew and Kurtosis factors that describe the overall shape of the waveform. Figures 3 and 4 show each of the metrics and potential variations from nominal. If any of the measurements deviate from a nominal value by a significant amount, an event is triggered, pre- and post-cycles are recorded, and reported to the back office.
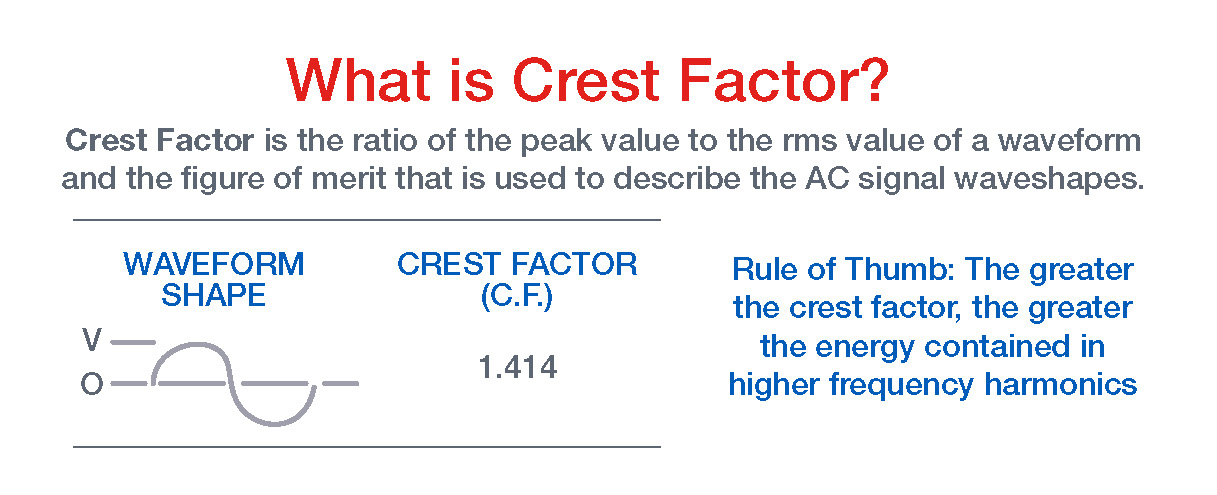
Figure 3: Statistical Analytics (Crest Factor) Used to Detect an Abnormal Waveform [3]; Image created by Itron.
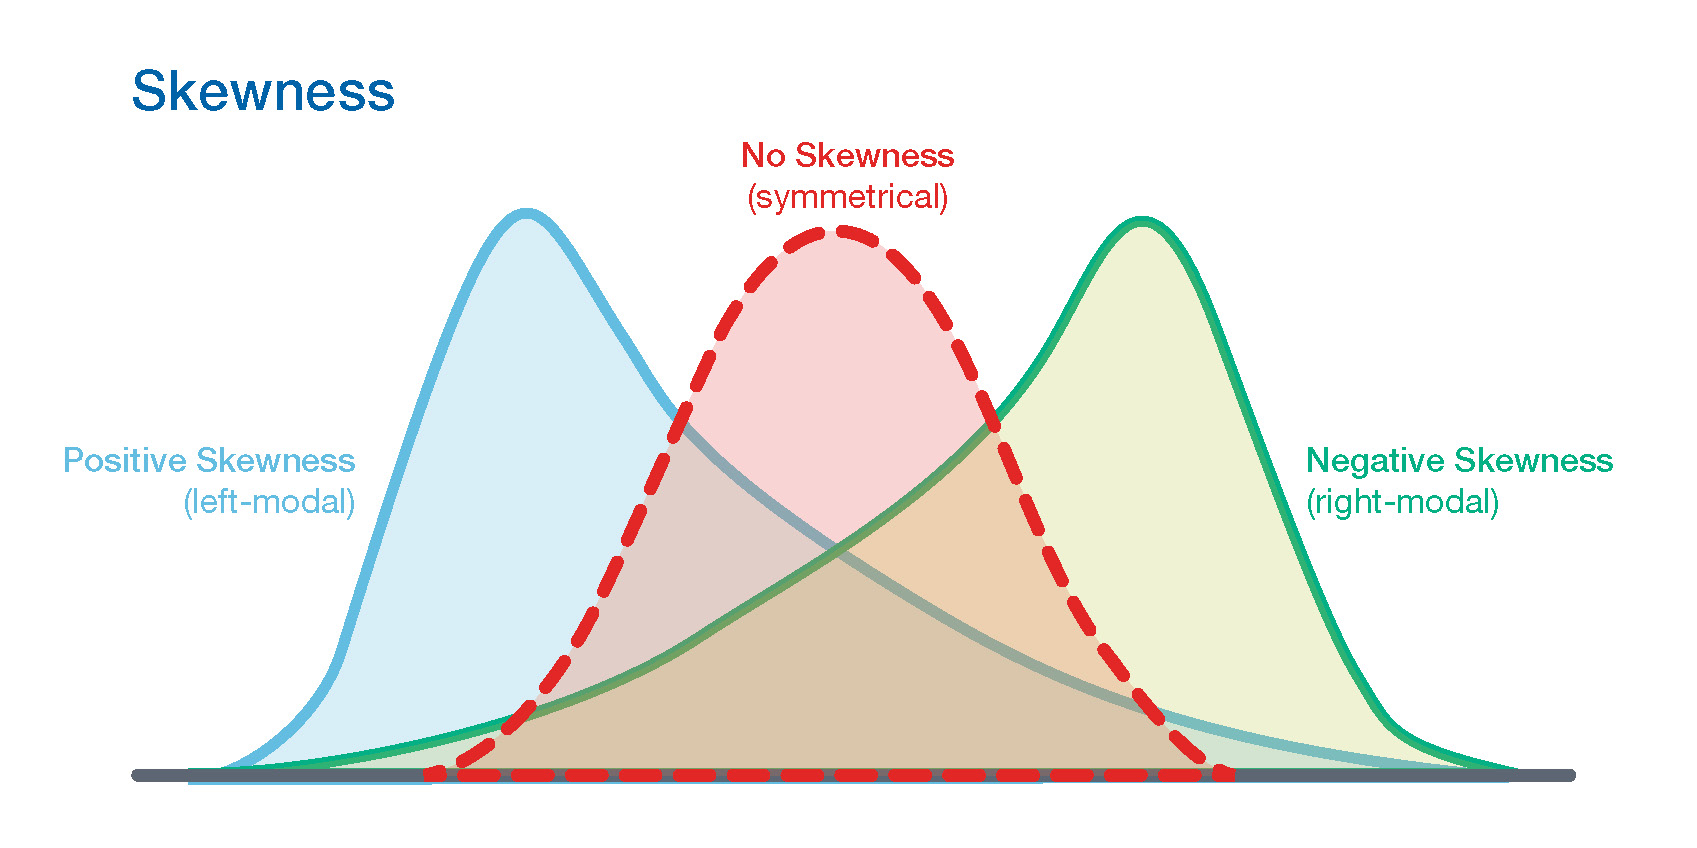
Image created by Itron.
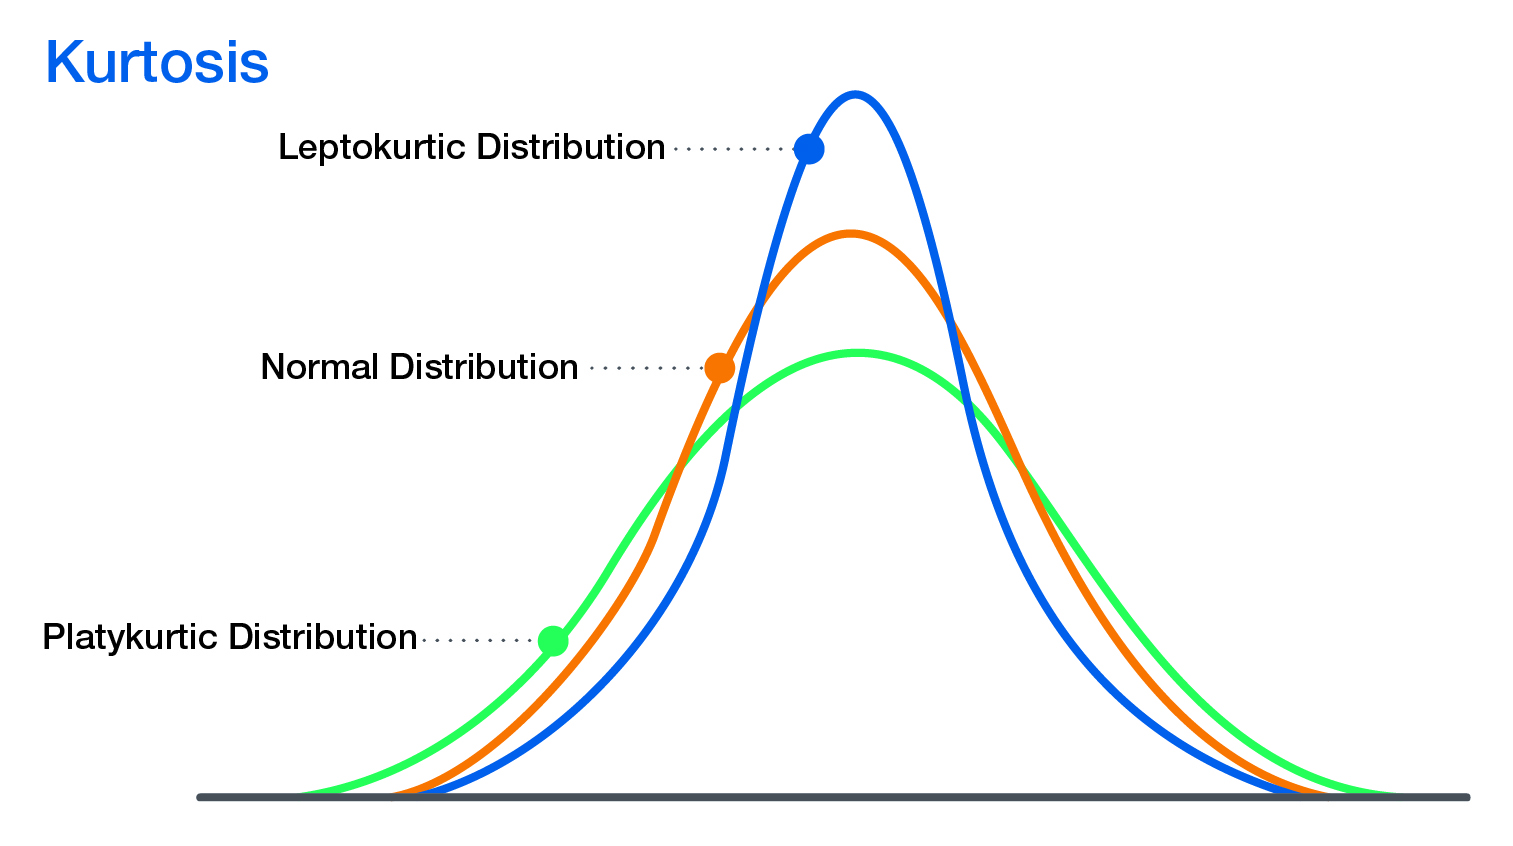
Figure 4: Statistical Analytics (Skew & Kurtosis) Used to Detect an Abnormal Waveform [4]; Image created by Itron.
Benchmarking and Validating
The first step in benchmarking and validating the algorithms is to establish a baseline of nominal values and the allowable variations for all three metrics. This is accomplished by recording over 180,000,000 ½ cycles for almost three weeks of “blue sky” days on a midwestern grid. Figure 5 shows the results of this recording and calculating the crest factor showing the minor variations detected over the entire period.
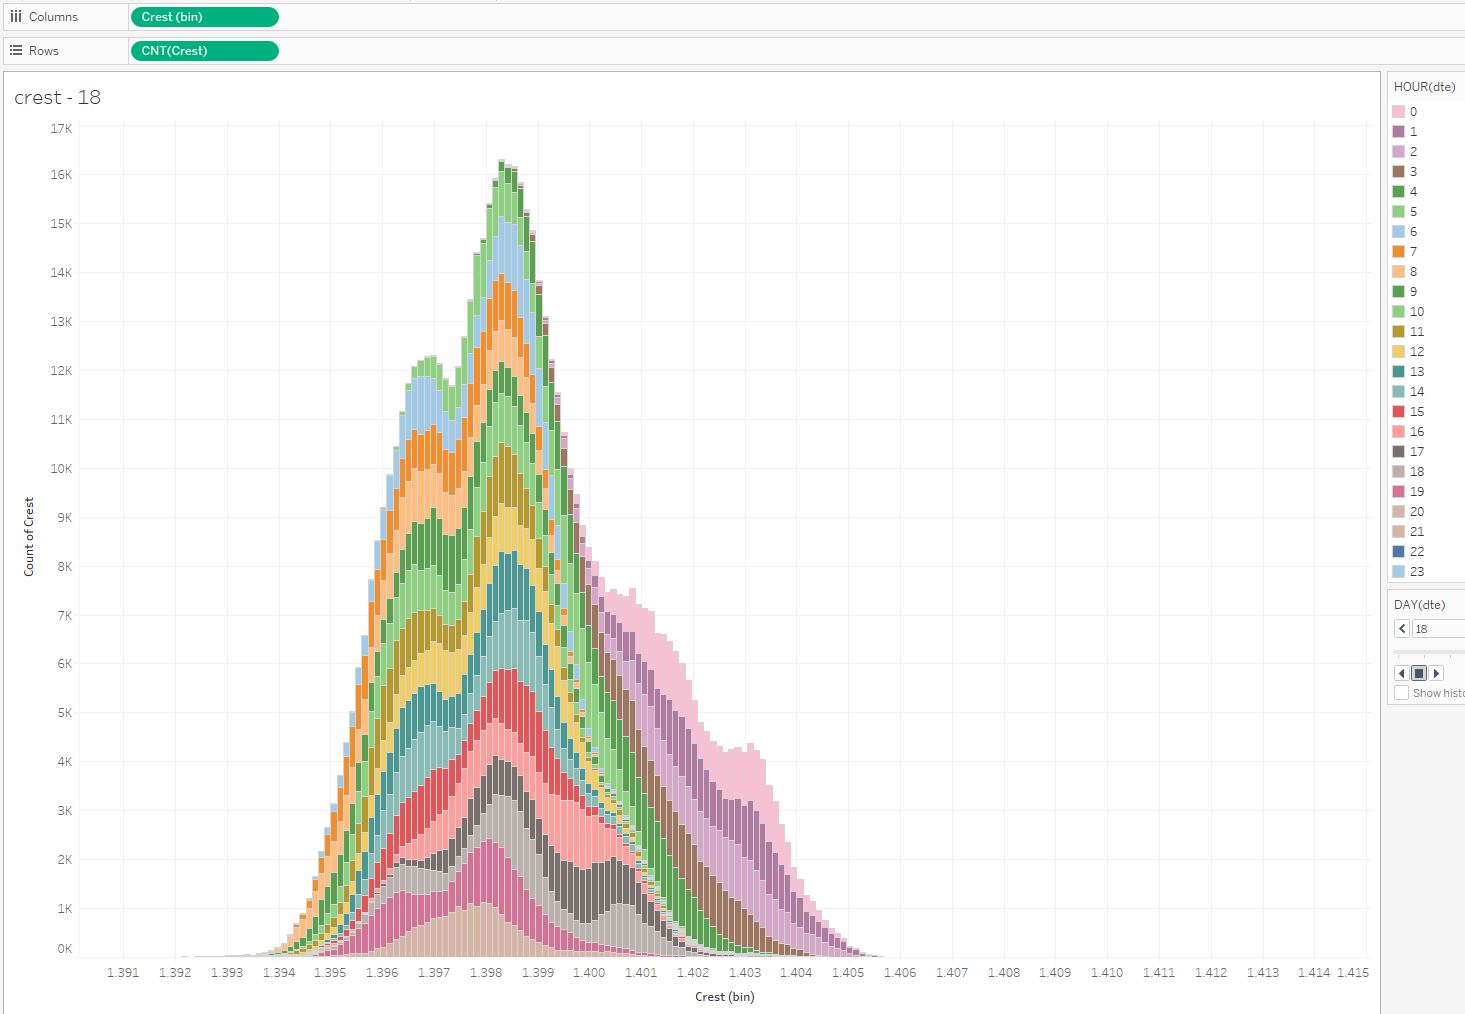
Figure 5: Blue Sky Crest Factor Spread [5]
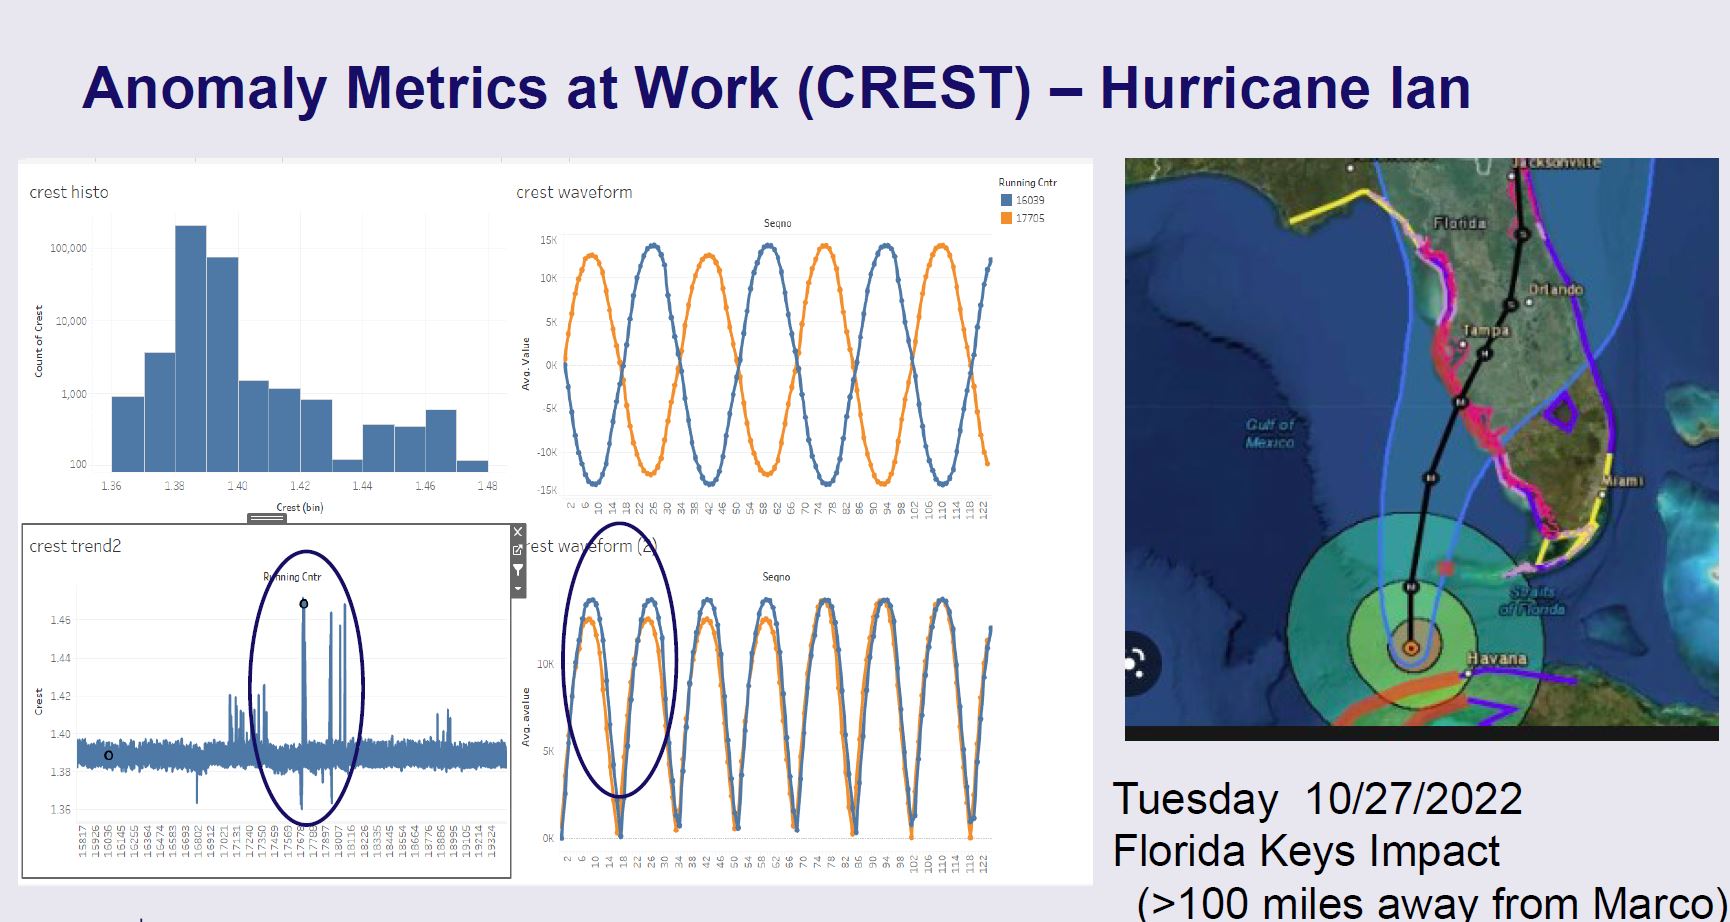
Figure 6: Anomaly Metrics at Work (CREST)—Hurricane Ian [6]
The Future of Anomaly Detection
Currently, Itron’s anomaly detection agent is undergoing final testing and is scheduled for deployment in November 2023. We are working with West Coast utilities to deploy and test the anomaly detection agent in several fire zones. The goal is for a mass deployment of the agent across an entire service territory to literally turn every meter into a grid sentry, continuously on guard for any potential disturbances/events.
Interested in learning more about distributed intelligence applications? Visit Itron in booth #8 at Utility Analytics Week, October 31-November 2, 2023, at the Loews Portofino Bay Hotel at Universal Orlando.
Itron is a solution provider member of Utility Analytics Institute.
References:
1Sinusoidal Waveforms, Electronics Tutorials, (https://www.electronics-tutorials.ws/accircuits/sinusoidal-waveform.html) (last visited on September 13,2023).
1Sampling rate of 1,382,400,000 bytes per hour calculation: 32,000 samples per second x six sensors (three voltage and three currents) x two bytes per sample taken 3,600 times per hour.
2Source: Electronics Tutorial (https://www.electronics-tutorials.ws/).
2US Patent Application No. 18/089,353 entitled “Voltage Grid Anomaly Detection”, United States Patent and Trademark Office, December 27, 2022 (Mel Gehrs, applicant).
3Source: Keysight Hands-On (https://www.youtube.com/watch?app=desktop&v=ynObUvO8HZc).
4Source: Analyst Prep (https://analystprep.com/cfa-level-1-exam/quantitative-methods/kurtosis-and-skewness-types-of-distributions/).
5Source: ITRON (https://www.itron.com).
6Source: ITRON (https://www.itron.com).

Mel Gehrs
Technical Sales Engineer
Itron
With degrees in Nuclear and Electrical Engineering from Kansas State University and a passion for building high-performance servers for data mining, Mel brings a uniquely broad and deep skill set to the smart grid. Initially, Mel spent 30 years at ComEd/Exelon working in all areas of the utility as Director of Strategic Planning. He then spent four years in his “dream job” at NASA that included projects like installing and testing super capacitors in an electric dragster. For the past 10+ years he has been working for SSN/Itron and is currently researching high speed metrology and the appropriate math algorithms to build the next generation of DI agents.