
Searing heat, torrential rain, devastating floods, intense windstorms, and wildfires. Our grandmothers’ and grandfathers’ asset management models may no longer be sufficient to meet the dynamic environmental challenges threatening the U.S. electrical grid. Modern tools such as real-time quantitative risk assessments (QRAs) and risk-evolution forecasting can enable utilities to proactively operate and maintain their equipment to effectively mitigate the impacts of shifting environmental threats.
As illustrated in Figure 1, many utilities today are combining technology and data, guided by cross-functional knowledge and expertise, into integrated tools for advanced decision-making.
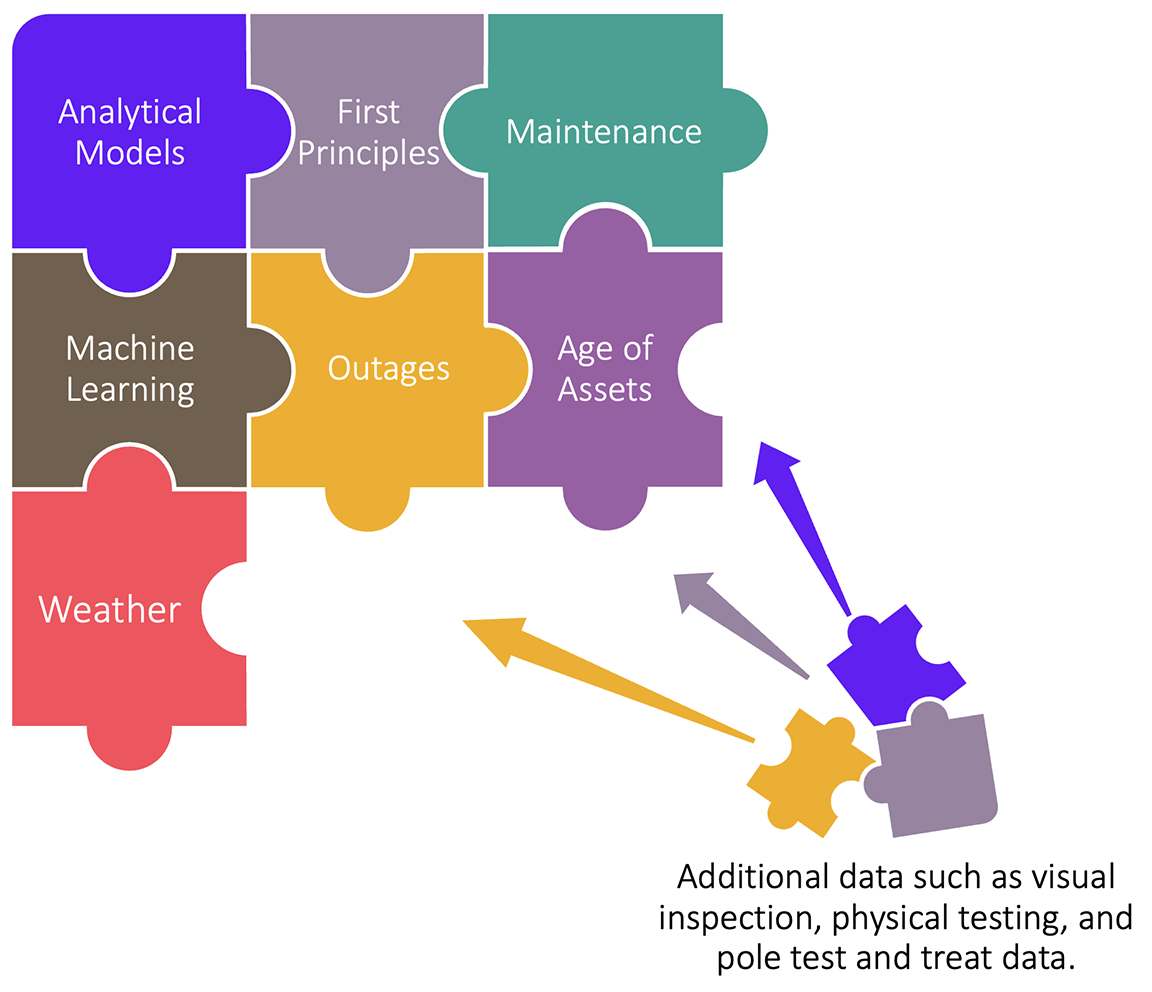
Figure 1. Advanced decision-making for risk analyses uses a combined approach where analytical and machine learning models (AM and ML, respectively) are paired with engineering (i.e., “first principles”) models, informed by reliable data.
Combining the best of AM and ML technologies with rich data
Analytical Modeling (AM) identifies mathematical relationships between multiple variables and conditions to predict an outcome through a repeatable, verifiable, and explainable methodology, that is, applied science and engineering. Since the underlying engine is transparent and can be analyzed in detail, AM provides a white-box solution where the described relationships clearly represent the physical processes.
Machine Learning (ML) differs from AM by learning from data without explicit heuristics embedded in the programming. Since its outputs cannot be precisely traced back to equations in the way engineering-first principles can, ML presents a black-box solution where the internal functioning is either hidden or too complicated to be analyzed. Nonetheless, ML typically achieves very good accuracy when the training data is rich, robust, and representative.
An AM approach will always have a visibility advantage over ML because the explicit mathematical relationships allow an observer to clearly identify relationships and work to explain them. Conversely, AM can be limited by its assumptions since most mathematical models cannot account for all the edge cases that changing climate conditions are presenting.
An ML approach will always have a capacity advantage over AM because it can identify relationships between data without the need for an explicit understanding of the “why” (e.g., the physical mechanisms at work). In other words, ML is about correlations, while AM is about causations. ML, however, is limited by the availability of clean, reliable, and complete data. Combining AM and ML into a complementary framework can create a powerful analytical platform that compensates for the inherent limitations in singular AM or ML approaches. Careful consideration of the strengths and deficiencies in each approach for the specific problem at hand can result in a balanced solution in which the strengths of one complement the weaknesses of the other. Positive feedback mechanisms are also established when the two are paired, particularly in terms of enhancing the collection, storage, and interpretation of new data.
Figure 2 is an example of a probabilistic model that characterizes the engineering performance of overhead electrical transmission assets. This model presumes a lognormal fragility function (probability of failure Fχ given a load intensity χ) was:
Fχ (χ) = φ(ln (χ) – µ / σ) defined by only two parameters µ and σ.
In this case µ is the median asset strength, as determined using engineering analysis based on well-known laws of mechanics (i.e., AM). The dispersion is a measure of the composite uncertainty in the data, models, and underlying random environmental processes, and can be difficult to track and quantify in a purely AM approach. Where quantification of σ is not amenable to AM, an ML model was developed to estimate an appropriate dispersion for the fragility function. The intensity measure (x) of interest could be any extreme environmental load that could trigger a failure or outage, such as peak wind gust speed or ice accretion thickness.
Utilities typically have a broad collection of operational data to work with related to inspections, maintenance, outages, and associated assets at different sites. They can access relevant external data, such as weather data for different geographic locations. Collectively, this data can provide rich information that is ripe for analyzing for intelligence and insights, but the bridge between data and decision-making is where subject matter experts — engineers — are critical to developing the right solutions. First principles are scientifically derived ideas, concepts, and rules that frame solutions to complex engineering-based problems. Engineers use simplified versions that allow practical application for a wide range of problem-solving in multiple disciplines, including structural/mechanical engineering, electrical engineering, meteorology and climate studies, and data science. It is advantageous to leverage cross-functional capabilities to address the multifaceted challenges facing utilities, and consistent application of first principles allows for consistent, risk-informed decisions for multiple asset types and hazards.
PG&E Case Study: Toward QRA For Overhead Transmission Line Asset Management
As PG&E pivoted its asset management strategy from an age-driven (i.e., run-to-failure) approach to a risk-driven one, a clear need surfaced to rapidly develop and deploy risk models that could support decision-making. Dozens of risk models were developed, validated, and deployed into production under two risk-based decision-making umbrellas: (1) real-time decisions, named “Operational Assessment (OA),” and (2) annual and future decisions, named “Wildfire Transmission Risk Model (WTRM).” Multiple threats (phenomena that reduce a component’s ability to resist the effects of a hazard) and hazards (events that cause a component failure) were identified and modeled using either AM or ML. This effort relied on several teams spanning both PG&E and Exponent to accomplish.
Some examples of the AM approach included modeling atmospheric corrosion, underground corrosion, aeolian vibration (e.g., low-cycle fatigue), annealing, conductor-to-structure flashover, and contamination-induced flashover. Examples of the ML approach included quantifying bird and animal threats, vehicular impacts to support structures, and gunshot damage to electrical infrastructure. These models were subsequently tailored to specific components, such as conductors, insulators, foundations, and hardware, which multiplied the number of risk models constituting the OA and WTRM.
Problems were sometimes encountered with a singular AM or ML approach. For example, one model initially attempted with the AM approach did not perform well because the input parameters could not form a tractable mathematical model. A subsequent ML approach seemed better, but further validation identified numerous inadequacies with the approach. However, once engineering principles were integrated into the model, the respective advantages of AM and ML balanced the deficiencies of either singular approach and produced validated results.
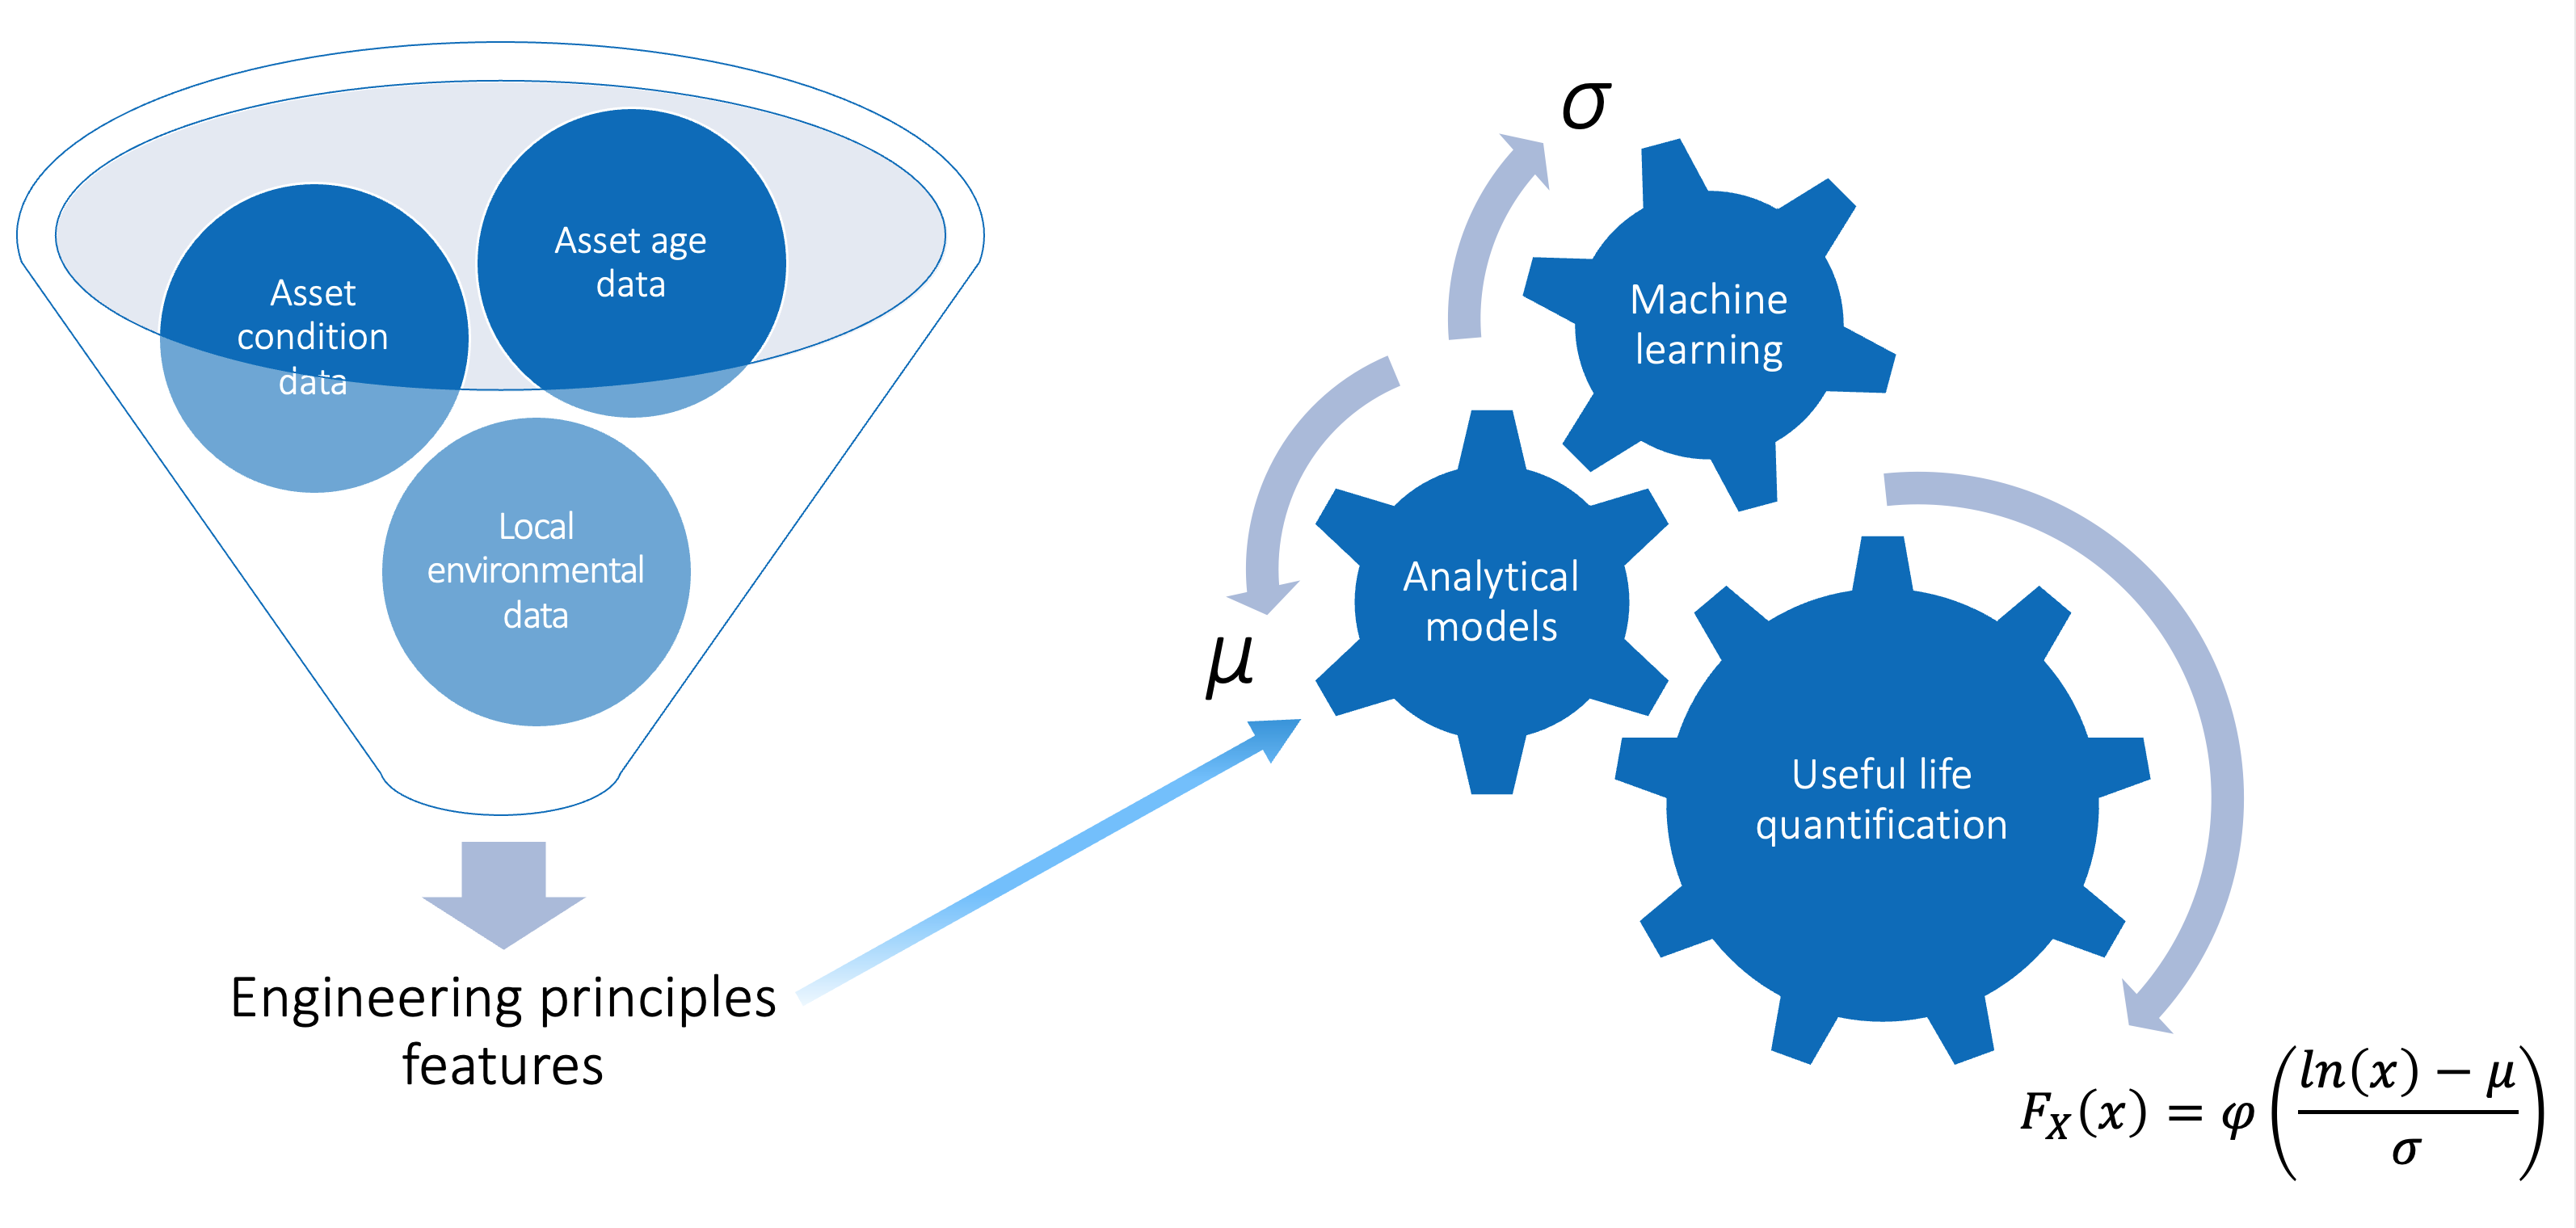 Figure 2. Engineering principles quantified from asset-specific data are provided to both the analytical and machine learning models to quantify asset useful life. The logarithmic mean (µ) from the analytical models is combined with the uncertainty parameter (σ) from machine learning to quantify useful life, presented here as the cumulative distribution function of the lognormal distribution. The parameter, x, in the example discussed herein is the wind gust speed but can be any intensity measure of interest.
An example in practice
Problems were sometimes encountered with a singular AM or ML approach. For example, one model initially attempted with the AM approach did not perform well because the input parameters could not form a tractable mathematical model. A subsequent ML approach seemed better, but further validation identified numerous inadequacies with that approach. However, once engineering principles were integrated into the model, the respective advantages of AM and ML balanced the deficiencies of either singular approach and produced validated results.
Issues with wear persistently besiege mechanically fastened components that are designed to allow movement between two faying surfaces, and thus are susceptible to repetitive movements from periodic load fluctuations such as gusting winds. A notable example of mechanical wear failure was discovered after the 2018 Camp Fire, where subsequent investigations identified multiple worn C-hook and hanger plates connecting jumpers to tower arms.
PG&E has since taken substantial steps to preemptively identify and mitigate mechanical wear issues by tracking evolving risk and intervening before the risk threshold is exceeded. This was achieved by:
- Using AM to construct a mechanical wear model derived from first principles dynamics and identifying important parameters that could detect locations of vulnerability to wear (such as wind environment and connection geometry);
- Collecting data on all known wear issues contained in inspection reports and maintenance records, including all associated asset-specific information (such as tower location, type and age);
- In parallel, identifying additional mechanical wear parameters for the ML model to supplement the first principles input parameters; and
- Combining the AM and ML approaches by feeding the outputs from the AM into the ML model.
Meet the Authors:

Manuj Sharma, Principal Technical Product Manager (ML\Data Science) at Pacific Gas & Electric Company
Manuj Sharma is a seasoned product manager and data-driven decision-making advocate. Mr. Sharma brings more than 10 years of experience in business intelligence, product analytics, predictive analytics, business consulting and business process management to his work as principal technical product manager at PG&E.

Jonathan Glassman, Ph.D., P.E., CRE, CSQE, Senior Managing Engineer at Exponent
Jonathan Glassman is a software and data science consultant, as well as a practicing civil engineer and reliability engineer, with extensive expertise as a developer, solutions architect, product owner, project manager, field engineer, and risk modeler. Dr. Glassman combines his experience across software solutions, data science, and civil engineering to support clients with data quality mitigation, product development, and risk management and decision-making.
Exponent is a sponsor of UA Week 2023. Pacific Gas & Electric Company is a utility member of Utility Analytics Institute.