
Read how Snohomish Public Utility District’s data strategy strengthened its team to deliver analytics efficiently and effectively to 1,000 coworkers and 390,000 utility customers.
When Snohomish Public Utility District (SnoPUD) decided to amp up its analytics capabilities, the analytics team took into consideration other utilities’ journeys as they built their own data strategy. Phil Prentiss, data architect, remembered hearing about another utility’s strategy. The utility, which was just a little larger than SnoPUD, had contracted with a large consulting firm and worked with 20 consultants to complete a data lake project. SnoPUD’s small yet innovative analytics team took a different approach.
Under the direction of Chris Britsch, senior manager of Data and Analytics (D&A) who was recently recognized with the 2023 UAI Excellence Award for Best Utility Analytics Leader, SnoPUD’s small team moved up the UAI analytics value curve (Figure 1) from descriptive analytics to predictive and prescriptive analytics within 10 years. Since 2014, the analytics team has grown from two data analysts to a team of 12 experts in planning, data science, performance dashboards, reporting, application support, data engineering, data architecture, and cloud architecture with a customer-centric perspective. The team now has a data and analytics platform with templates that enable them to quickly meet the analytics needs of its diverse user groups.
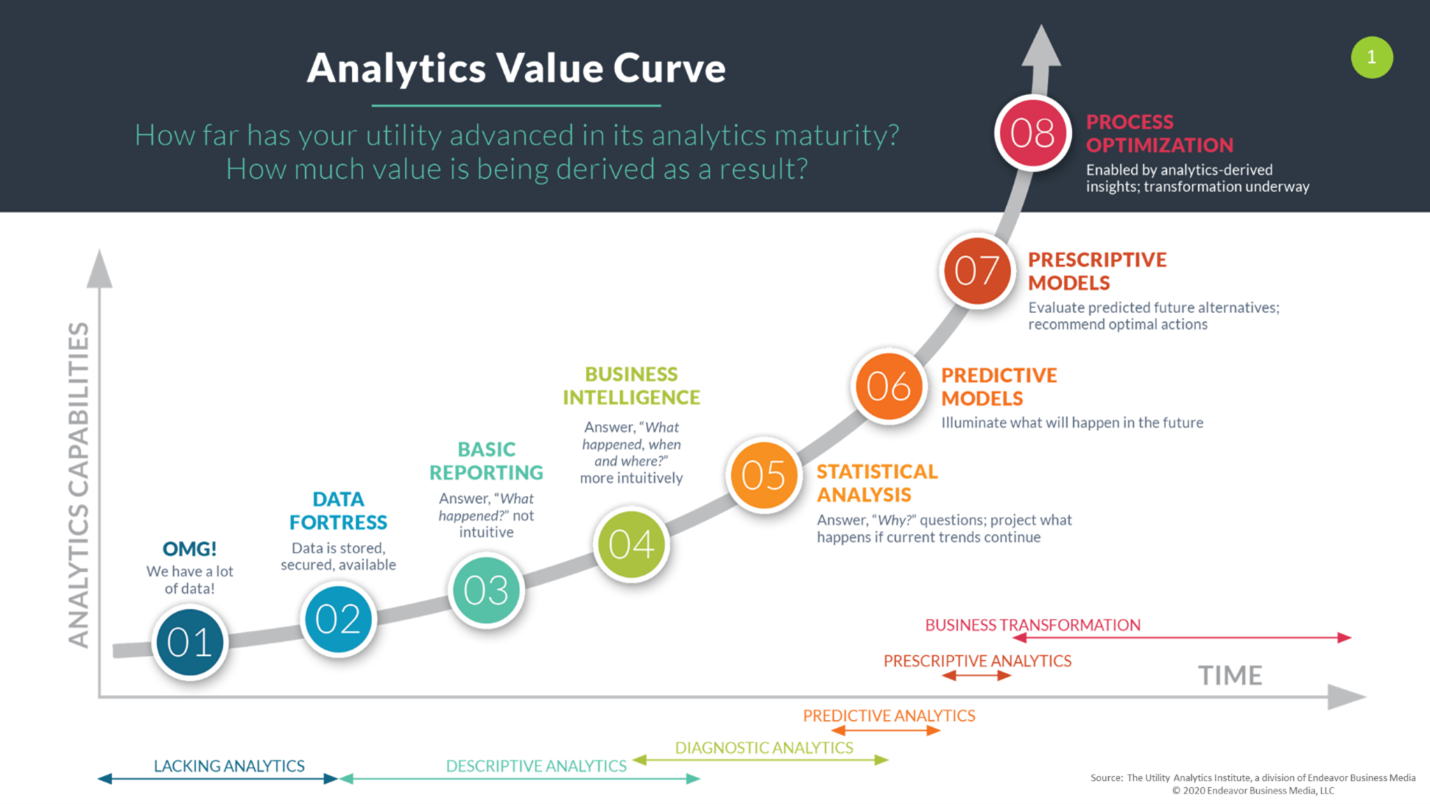 Figure 1 Analytics Value Curve. 2020. Utility Analytics Institute, a division of Endeavor Business Media. https://utilityanalytics.com/value-curve2/
Personas behind the strategy
Central to the SnoPUD strategic approach was the idea that analytics capabilities must serve predefined personas (Figure 2). Phil Prentiss, data architect, together with Britsch defined four personas as their starting point:
- Analytics consumers — Anyone within the business who consumes content produced by the D&A team based on specifications provided by the business (e.g., a load forecaster).
- Citizen data scientists — Subject matter experts requiring data access to create math-intensive or statistical solutions on their own (e.g., an analyst creating rate structures).
- Analytics power users — Users needing access to larger datasets for aggregation and analysis but not necessarily for the creation of a complex analytics product (e.g., a business analyst or energy efficiency program manager).
- District customers — The 367,000 people who get their electricity from SnoPUD or the utility’s 23,000 water customers.
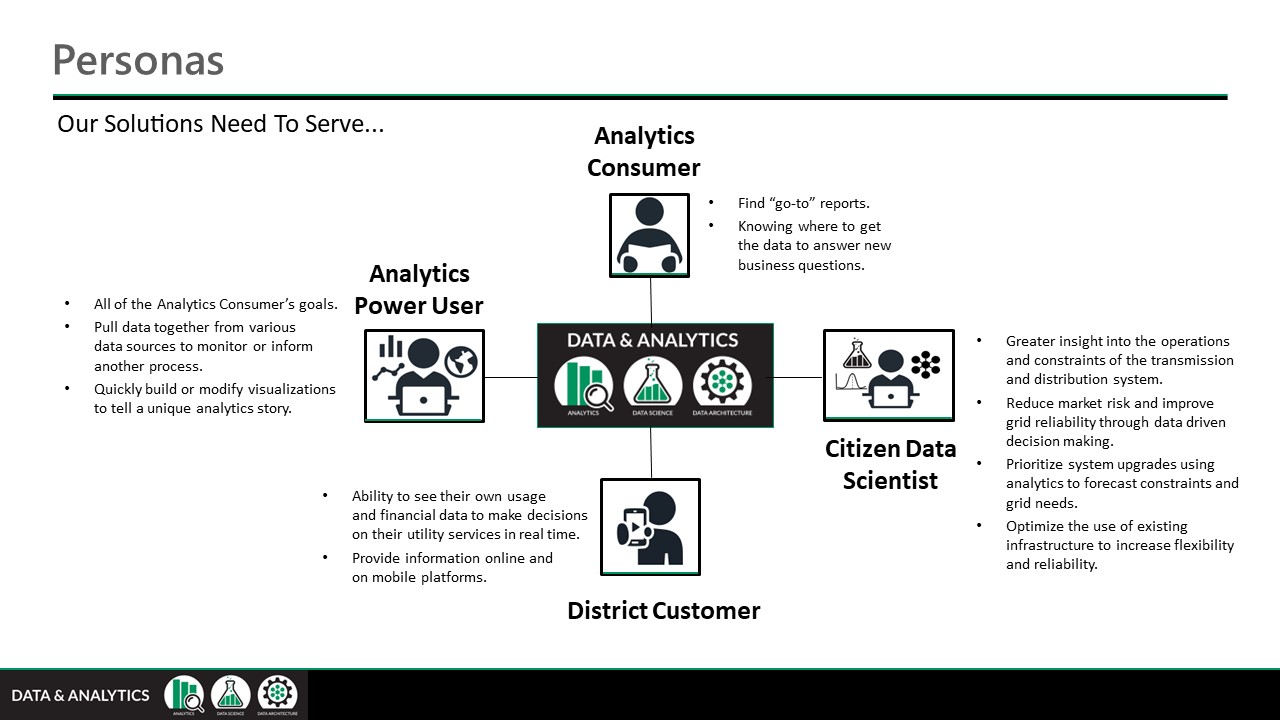 Figure 2 Data & Analytics Evolution at Snohomish County PUD.pptx. 2023. Snohomish County Public Utility District. Reproduced with permission.
Empowering analytics self-service was one of SnoPUD’s data management priorities. In 2014, the small team predominantly served analytics consumers and power users using SAP Business Warehouse to provide reports from the transactional SAP HANA databases. The team expanded their analytics platform by using an SAP BusinessObjects tool to interface with data from additional on-premise data sources, such as network files, SharePoint lists, custom databases, and additional SQL Server and Oracle application databases, to enable self-service reporting and analysis.
Building for agility
By 2018, the D&A team added Microsoft Azure to the architecture to increase their agility. With it, they included Power BI, a low-code self-service tool for analytics creation. In addition, they added the open-source KNIME Analytics Platform, which makes analytics accessible to beginners through a low-code / no-code interface as well as provides an advanced data science set of tools for more experienced users.1 These tools helped the team to better serve their citizen data scientist persona.
By 2020, the SnoPUD team was laying the IT foundation to leverage advanced metering infrastructure (AMI) data. The subsequent additions of an AWS-hosted meter data management (MDM) system and customer portal opened up an additional cloud option to expand SnoPUD’s analytics platform architecture. Prentiss noted that though the utility already had a large footprint in Azure, the data gravity within the AWS environment due to these new applications tipped the scales toward AWS.
TechTarget attributes the term “data gravity” to IT expert Dave McCrory and defines it as the tendency for applications, services, and other data to draw close to data as it grows in mass in order to increase the efficiency and thus the speed of workload performance.2 According to Matt Zyskowski, data and analytics engineer at SnoPUD, having other utilities in the area that used a similar architecture allowed the SnoPUD D&A team to leverage the knowledge and experience of their utility counterparts, thus strengthening confidence in their decision.
Their decisions have had a positive impact on their growth strategy, allowing the team to leverage scalable compute power, AWS services like SageMaker, a fully managed machine learning service3, and larger-scale Python scripts to create and manage more complex analytics solutions. “Having one single source of truth is enabling all of our data science use cases to move forward,” noted Charles Hersrud, data scientist at SnoPUD.
Having one single source of truth is enabling all of our data science use cases to move forward. – Charles Hursrud, Data Scientist
Moving from traditional data warehousing to a data lake environment allowed the team to expand their use cases, but it also required new skills. Matt Zyskowski credits much of their success to the long runway senior leadership gave the D&A team to develop their infrastructure and analytics proficiency. Once they began using AWS, the team jumped headfirst into acquiring new expertise, incorporating Python, R, and other coding languages into their primarily SQL-based analytics tools.
The team spent months honing their cloud development skills using online training platforms that featured lab-based learning environments. Prentiss observed that this runway, the ability to learn without high pressure, and trying out new patterns and protypes in a test environment allowed them to adopt best practices as they moved forward. Then during early development stages, the team obtained additional assistance and feedback from a consulting cloud advisor.
Becoming Enablers
The D&A team standardized processes to enable self-service among citizen data scientists and increase product speed to market, boosting productivity and analytics adoption at the same time. The team used code templates whenever possible to enable citizen data scientists to deploy analytics products into production with little to no assistance from the team. John Norberg, data and analytics engineer, explained that they used AWS Cloud Development Kit (CDK)4 to define infrastructure as code as part of their data strategy, enabling users with no previous knowledge of AWS to see their data in the cloud within about an hour.
In conjunction with speed and agility, security was built into the pathway data traverses within the D&A platform. According to Zyskowski, the team identified multiple patterns that provided secure navigation from the ingestion layer, through the extract, transform, and load (ETL) process, and into the consumption layer. The team provided a template for use cases that generate all components to securely obtain and publish data, again increasing speed to market for new data and analytics products.
Along with offering nimble analytics support for end users, the utility’s current architecture facilitates more innovation and allows for a better understanding of return on investment. The current architecture also enables the team to test proofs of concept on projects in a sandbox, figure out how much they will cost, and then come back and give internal customers a reliable price. “Before, we were constrained to expand our analytics possibilities to meet our growing analytics needs,” Britsch said. “Now, we can spin up more resources to meet certain analytic and data science use cases and throttle down for others. We now have flexibility to expand on our infrastructure as our analytics demands grow.”
We now have flexibility to expand on our infrastructure as our analytics demands grow. – Chris Britsch, Senior Manager of Data & Analytics
Evangelizing analytics through reputation and education
Britsch credited this milestone to the team’s reputation for delivering value and their concerted efforts to educate peers and leadership. The benefits of analytics have infiltrated throughout the SnoPUD organization, all the way to the front line. The D&A team has moved deeper into the utility workforce with their analytics rather than primarily serving knowledge workers and the C-suite. For example, D&A’s internal analytics consumer customers, like line workers, have reached out to the D&A team for help. Line workers, who fix and maintain millions of dollars in assets, have come to rely on the D&A solutions.
Another recent example was the development of a dashboard that monitors fish habitat in relation to hydropower generation. The D&A team created a mobile dashboard so the natural resources department can take those readings from their phone, wherever they are. Hersrud pointed out that this project was not something that would have been brought to the analytics team in the past because manual readings were accepted as the norm.
The team identified additional use cases to focus on, including:
- Interval data, cross-system synchronization, statistics, and exceptions from AMI data.
- District billing and revenue aging finance snapshots.
- System and weather measurements from operation sensors.
- Customer 360.
- Asset 360.
- Customer level load monitoring and machine learning.
- Risk simulation modelling.
- Drone imagery for asset maintenance and wildfire mitigation.
These examples are evidence of the success of the SnoPUD D&A team’s campaign to enhance the experience of their coworkers and utility customers through a strategic approach that empowers the workforce from every angle. “We are empowered by executive leadership to drive towards a common strategic direction for data management. This has allowed us to successfully meet our strategic objectives and provide value now and on into the future” Britsch said.
We are empowered by executive leadership to drive towards a common strategic direction for data management. This has allowed us to successfully meet our strategic objectives and provide value now and on into the future. – Chris Britsch, Senior Manager of Data & Analytics
Snohomish Public Utility District is a utility member of Utility Analytics Institute (UAI).
Betsy Loeff is a Colorado-based freelance writer who specializes in B2B content creation and trade journalism. Her business, Write Results, serves publications and technology companies focused on the utilities sector. Read additional UAI articles by Betsy Loeff.
References:
1.KNIME. 2023. KNIME Analytics Platform: An intuitive, open source platform for data science. https://www.knime.com/sites/default/files/2022-12/KNIME_Analytics_Platform.pdf
2.Wigmore, I. 2017. Definition: Data gravity. TechTarget.com. https://www.techtarget.com/whatis/definition/data-gravity
3.AWS Developer Guide. 2023. What is Amazon SageMaker? https://docs.aws.amazon.com/sagemaker/latest/dg/whatis.html
4.AWS Developer Guide. 2023.What is the AWS CDK? https://docs.aws.amazon.com/cdk/v2/guide/home.html