
Asset analytics can help make the shift from run-to-failure to predictive and condition-based maintenance.
This is the second part of a two-part series. Read part one here.
Process and tool challenges
The ability to collect and organize data is often the primary obstacle to making sensible use of analytics for asset management application. These data challenges are often systemic in that the challenge stems from technological concerns with improper analytics software configuration or problems data quality concerns. Any combination of these factors can quickly diminish a utility’s ability to confidently use analytics for asset management. This results in the utility quickly reverting to the traditional break-fix approach as the risk of overreliance on flawed analytics could lead to catastrophic failures. Therefore, it is critical that utility operators identify and proactively address the process or tool-related obstacles most often associated with utility analytics:
- Data Acquisition
- Data Architecture
- Data Quality & Management
- Organizational Alignment & Change Management
Data acquisition
Ideal data acquisition includes knowing what data is needed, where it is sourced, and how it is acquired. Some asset classes are well suited to support real time data acquisition either through SCADA or AMI technology investments, which can be a valuable input to asset analytics. For asset classes where this sensor/monitoring technology may not be available, utilities must look to acquisition of data through other means. The use of paper forms for inspections leads to inconsistent completion, and some records never get used because they are lost or never get integrated into digital storage.
In these cases, many utilities are arming field crews with mobile tablets rather than paper forms to acquire more structured and useful data. Electronic forms can provide more interactive and informative inspection workflows, standardize the data collected, and streamline the data integration process downstream. In the longer term, new technologies such as Augmented Reality and drones provide additional potential for improved effectiveness and automation of inspection workflows through digital ingestion, organization, and translation of data.
Another best practice is to define a current state and future state process for getting data to the right destination for analysis. Clearly defining the process helps to identify related or supporting datasets and helps to ensure that the data gets to the right end users. This process should document the journey of the data from the field to various source systems and finally a data lake or data warehouse where it can be used for analytical analysis. A data acquisition process flow (figure 3) can help answer the following about the type of data collected:
- Is the right data being collected during install?
- Is the right data being collected during inspection/maintenance touch points?
- Is the right data being collected after failure?
- Is data being stored in the right place, and is it accessible?
- How are corrective actions or replacement decisions implemented, and how does that data get incorporated as an input to the process?
- Are there different departments involved in installing and/or maintaining the asset? Do these different departments use the same work order tools?
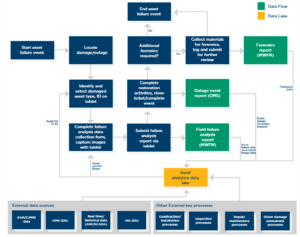
Figure 3. Example high-level asset data collection process flow
In practice, many utilities find that it is still difficult with digital forms to capture the right information, as the focus in the field is on safety and restoration of service, not data collection. However, data collection can be streamlined further by using analytics to proactively fill out the key data for the inspector/damage assessor to reduce the amount of interaction required to collect the data. In the long run, imagery and information collected from satellites and other technologies will further reduce the workload to maintain good data and improve the insights into the system required for predictive analytics.
Utility data governance and management
Issues with data quality and data completeness are often a roadblock to starting analytics. While systems may be in place to collect various asset data, the data is out of date, incorrect, or incomplete and governance/quality oversight of data is not in place.
Some best practices for data quality and management are:
- Data architecture: Identify the right systems and integrations to correlate asset base (EAM) to maintenance data (EAM/WAMS), outage data (OMS), and telemetry data (SCADA/AMI) to ensure the data is provided at the right interval in the right format for consumption.
- Data retention: Revisit data retention policies to consider how much data is necessary to train models. Additionally, it is important to retain records on retired or failed assets to help train models to predict future failures.
- Data quality: Determine data quality measures by which data quality can be quantified and prioritize quality issues. Examples of quality measures are completeness (i.e. number of records across a range of dates) and validity (i.e. whether data conforms to the format or standards for that data type)
- Shared business and IT ownership of data governance: data needs and process will change over time with new system implementations and evolving priorities from both IT and Business.
- Data cataloging: Create a reference of all relevant sources of data, how the data is being ingested, and who the end users of the data are.
Organizational alignment and change management
The aforementioned practices can fall flat without the proper organizational processes to ensure alignment between field, standards, asset strategy, and analytics teams on value of data and the reason for collecting it.
Alignment between the field and back office is critical. Field crews need an understanding of the right data to collect during installation, inspection/maintenance, and after failure, and an understanding of the importance of complete and consistently collected data to drive data quality. Likewise, analytics teams need an understanding of the procedures and processes to identify opportunities for better data and the effort required to get that data.
A fundamental characteristic of condition-based or analytics-driven asset management is flexibility as new information is learned. Utility leadership can foster flexibility and continuous improvement in this space by:
- Creating a mechanism to keep teams aligned as programs mature and processes improve
- Defining a corrective action strategy to answer how predictive analytics will inform action, budgets, process, and decision-making to replace or perform maintenance on assets prior to failure
- Formalizing alignment training on processes, technology, and the “why” behind the data initiative
- Making data science and data analysis training available to foster an innovative environment for employees and encourage building analytics skillsets
- Adding data visualization in a way to make sense of all the data
Lastly, many utilities struggle to build internal data analytics capabilities required to develop in-house analytics. It is known that there is a battle for data science talent to perform the fingers-to-keys analytics, but an organization can be deliberate with assigning and training other supporting roles to prevent the data scientists from being bogged down with ad-hoc reporting requests, data wrangling, or data cleanup. Many organizations find success in building their in-house analytics teams by defining clear roles along with training business users on self-service reporting and visualization tools such as Power BI or Tableau.
Conclusion
To successfully implement asset analytics, utilities must first focus on getting the data right and implementing the processes, technologies, and governance required to keep it that way. Once this foundation has been built, utilities can begin to build out the most valuable predictive analytics use cases and move from reactive replacement and time-based maintenance to inform proactive replacement and condition-based maintenance.
Moving toward condition-based and predictive maintenance can help to reduce O&M spend and allow for more strategic capital spending. Reducing corrective maintenance activities results in fewer truck rolls and less overtime. Reducing calendar-based preventive maintenance results in more money that can be spent for strategic O&M on high impact assets.
Asset analytics can help make the shift from run-to-failure to predictive and condition-based maintenance, and building a strong foundation with the proper processes and tools will help remove roadblocks and enable utilities to achieve the significant long term savings and benefits associated with asset analytics.
Authors
Eric Anderson, Senior Manager, West Monroe
Kevin Hade, Manager, West Monroe
Kojo Sefah, Senior Consultant, West Monroe